A new diagram view can be created by clicking on the “+” button at the top of the Diagrams List in the Custom Views section.

Adding Assets & Relations

Assets can be added via …
  • right-clicking on an asset/relation in the data schema and selecting + Add [...] or
  • left-clicking on an asset/relation in the data schema and selecting Add + in the emerging configuration panel on the left side.
Individual colors and shapes can be assigned to each asset and relation. In addition, analysis rules can be stored for each asset, which determine the color depending on certain properties.

Multi-selection

Multiple assets/relations can be selected by holding the Shift key and then …
  • by clicking on each asset/relation individually or
  • by holding down the left mouse button and drawing a selection rectangle around the desired assets/relations.
Afterwards, the selected assets/relations can be added via a right-click and choosing Add Selected Assets in the emerging context menu.
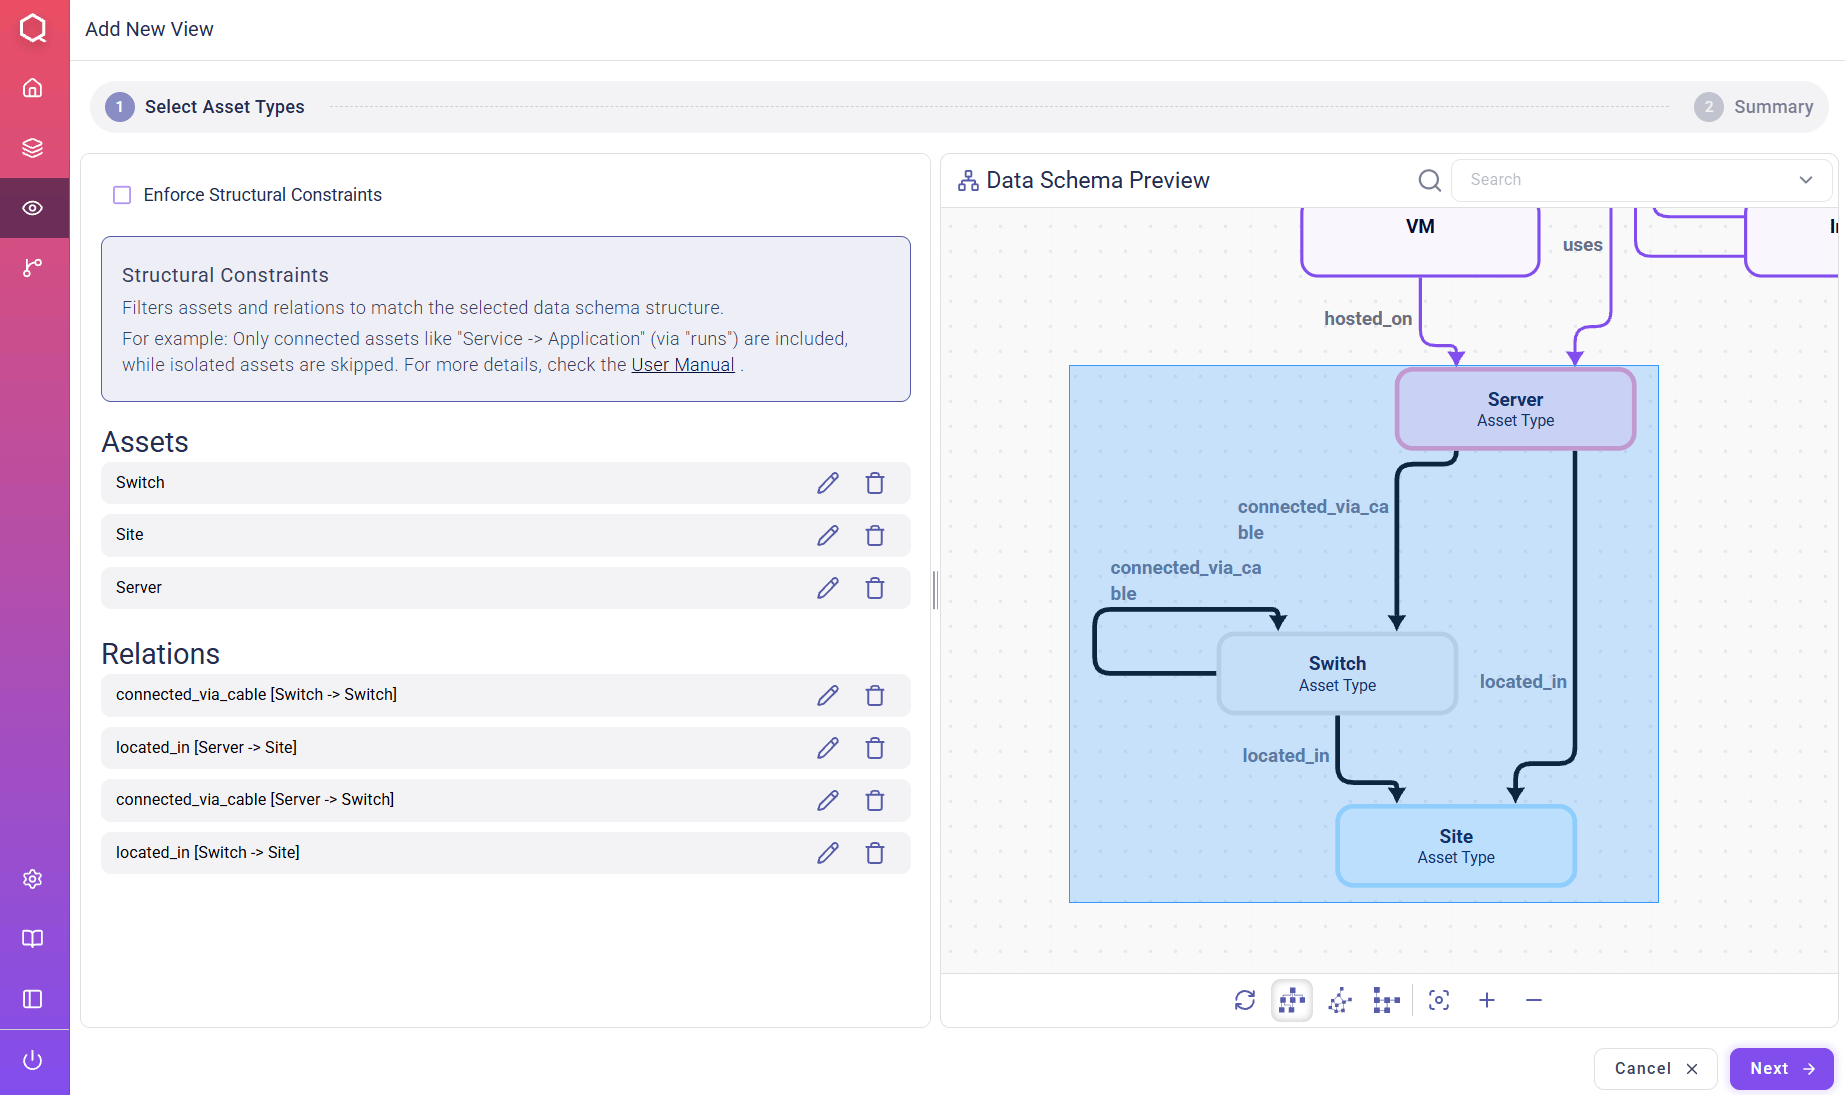
Creating Diagrams: Multi-selection
Multi-selecting asset and relation types by holding the Shift key while defining a new view Similarly, it is also possible to remove the selected assets.

Adding a relation

A single relation can be added by directly clicking on it. Its source and target assets will be automatically added too.
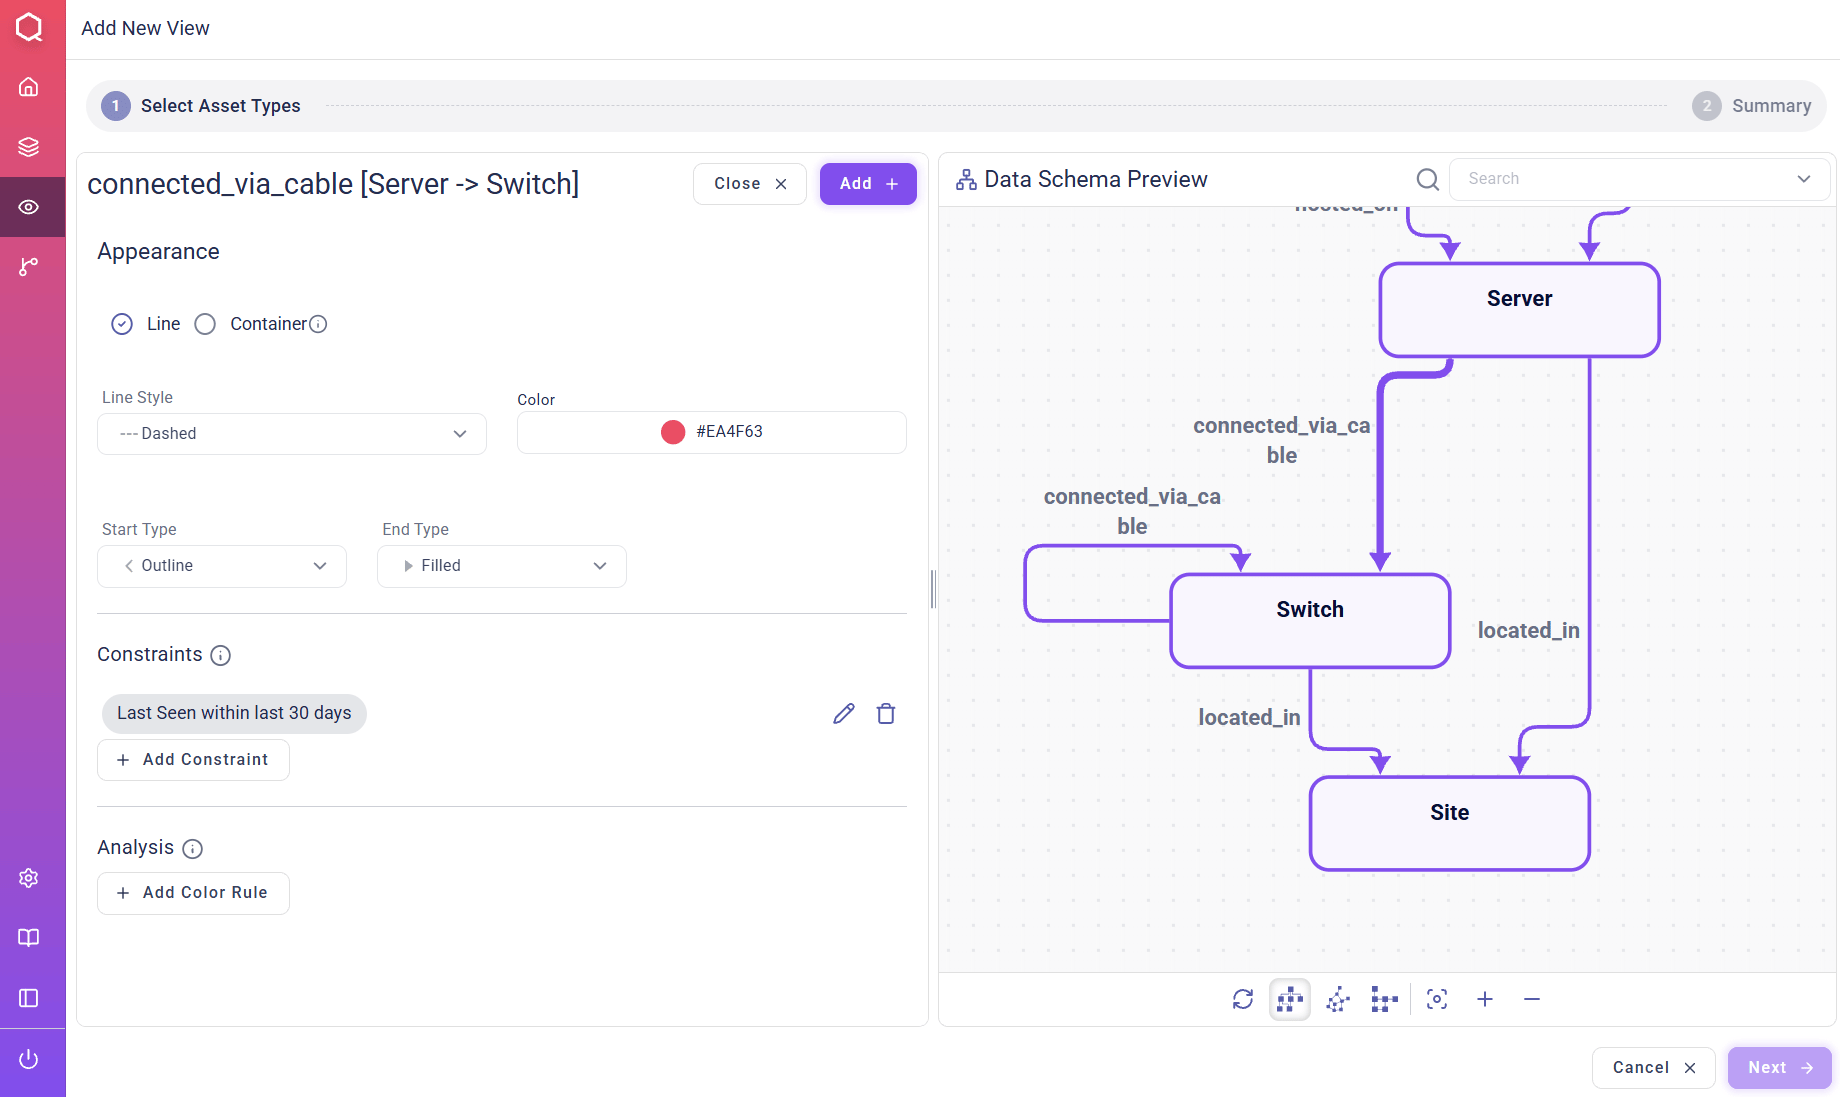
Creating Diagrams: Adding a relation
Adding a single relation

Adding an asset

A single asset can be added by directly clicking on it.
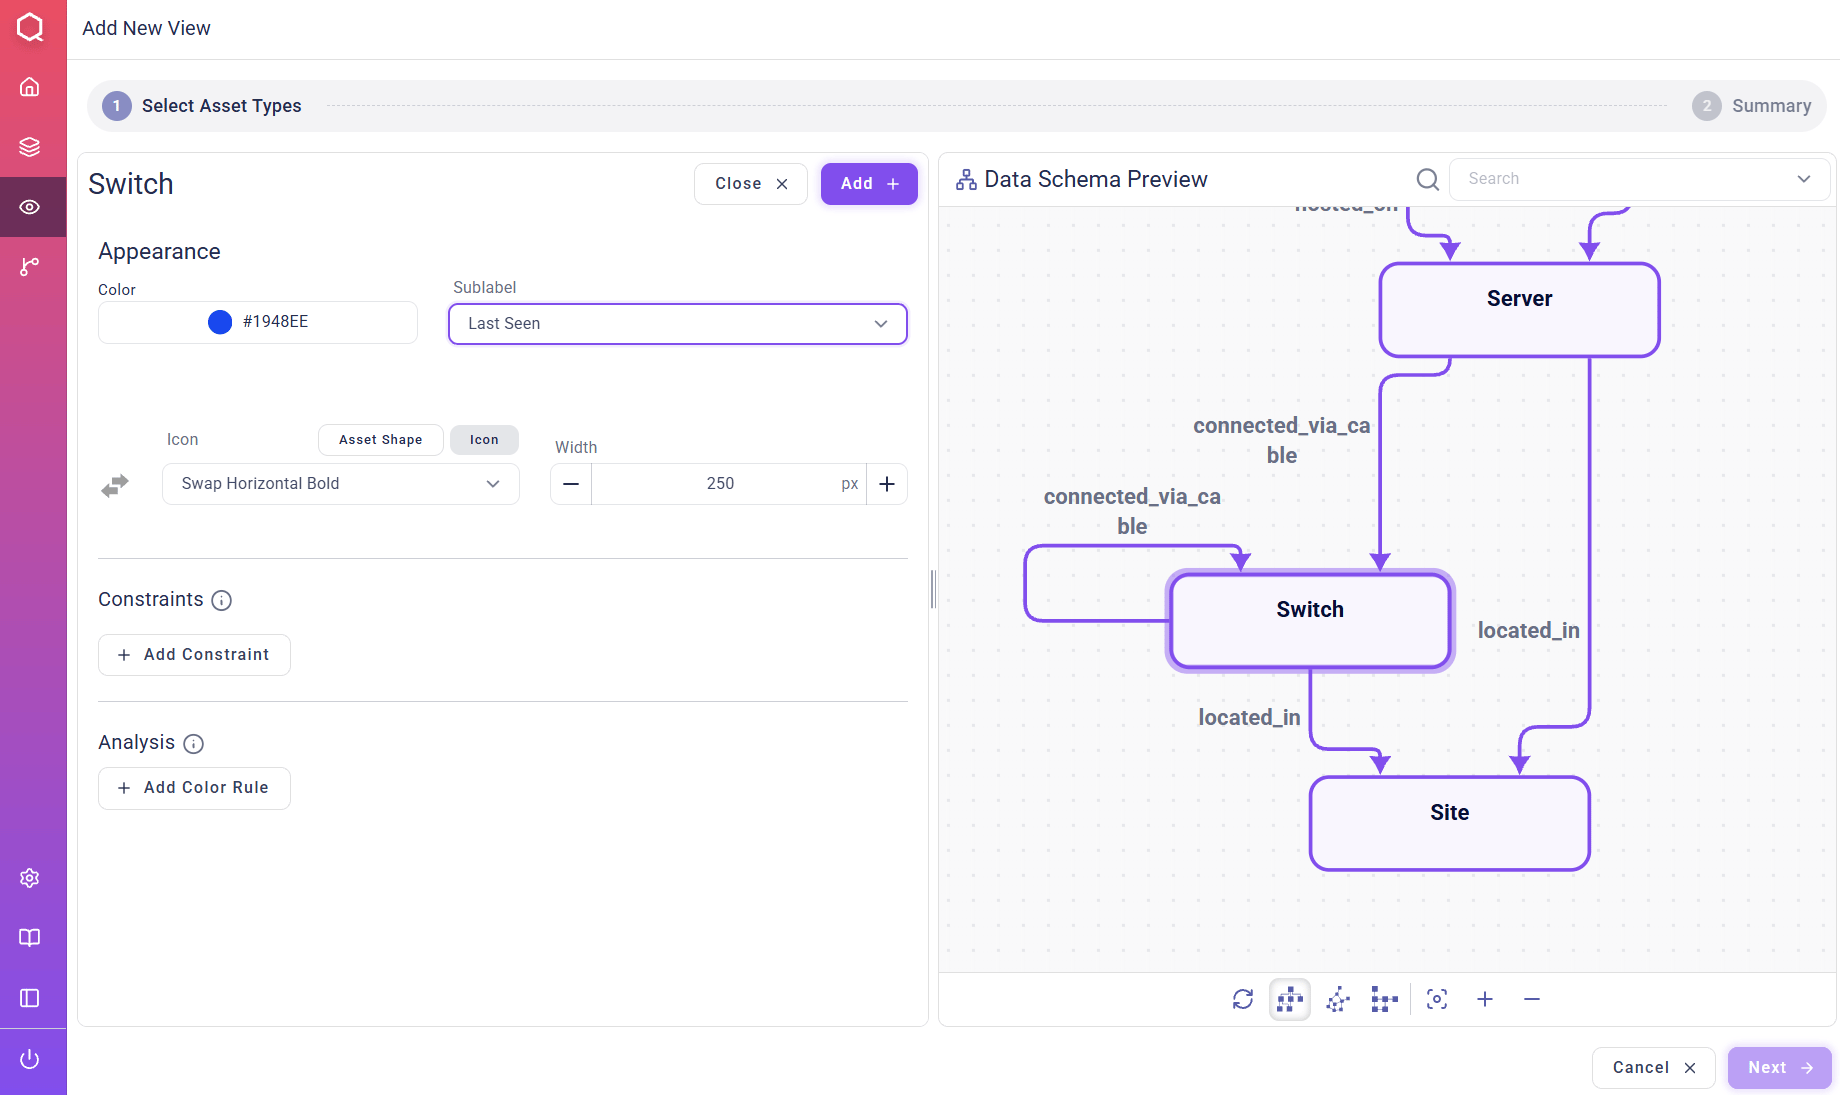
Creating Diagrams: Adding an asset
Adding a single asset

Changing Asset Appearance

Color picker The color of assets can be changed using the color picker.
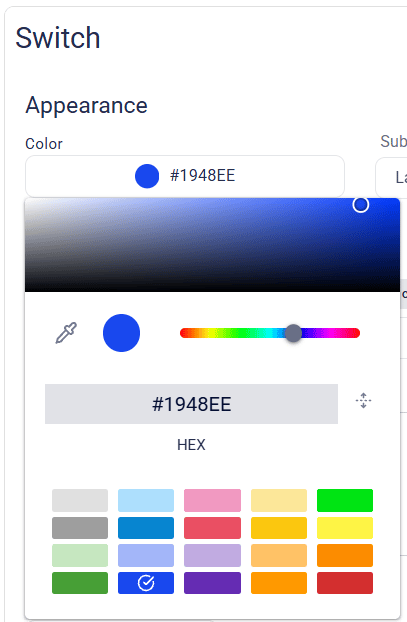
Creating Diagrams: Changing Asset Appearance
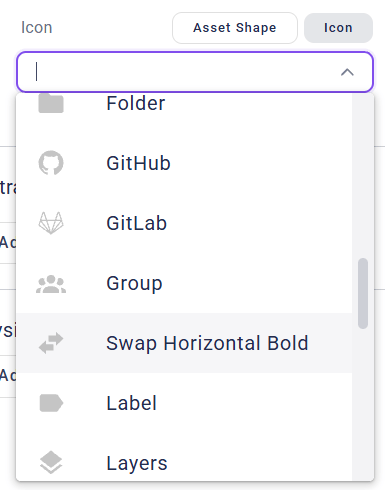
Color Picker Sublabels Sublabels are used to show a specific property value directly below an asset’s name within diagram views. Every available asset property can be selected as sub-label. Asset shapes There are different asset shapes to select from: regular geometrical shapes and icons. Icons make assets more appealing and intuitively understandable. Different icons can be selected for assets via the Icon tab.
Creating Diagrams: Changing Asset Appearance
Asset Size The size of assets can be changed via Width.

Changing Relations’ Appearance

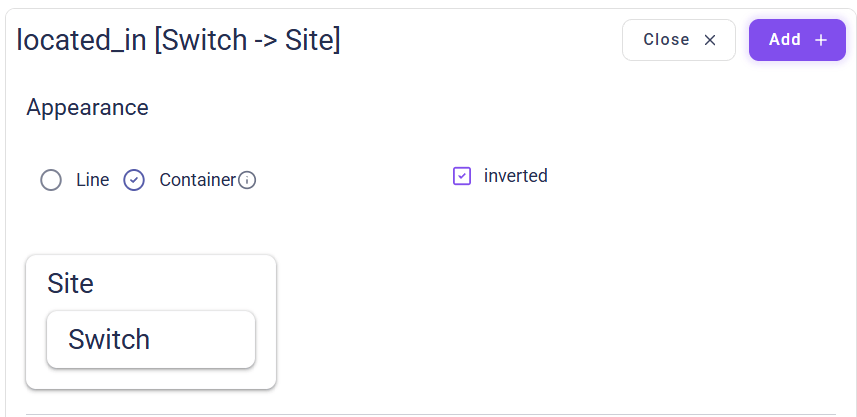
“Line” vs. “Container” Relations can be shown as lines or containers (nested/hierarchical boxes). If “Container” was chosen, the source assets of the relation are shown as “group assets” that contain the target assets of the relation.
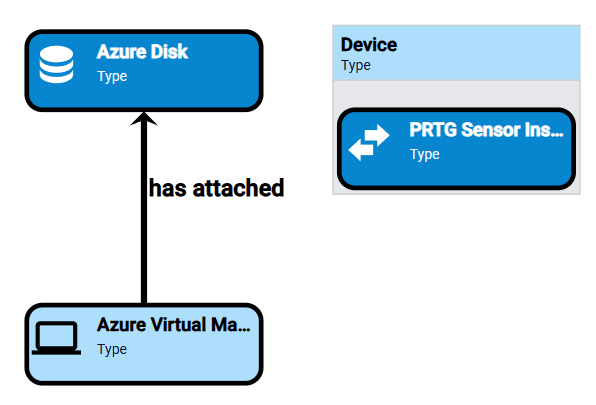
Creating Diagrams: Changing Relations' Appearance
Relation Appearance: “Line” (left) vs. “Container” (right) The “inverted” checkbox switches the role of source and target assets (i.e. the “direction” of the relation), so that the once nested assets are now shown as containers and vice versa.
Creating Diagrams: Changing Relations' Appearance
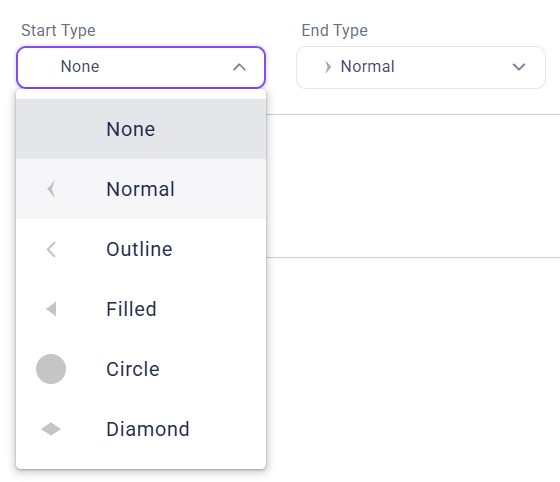
Relation appearance example for “Containers”: Here, “Switches” are shown as container nodes of “Sites”. Start and end type For relations, different start/end styles can be defined.
Creating Diagrams: Changing Relations' Appearance
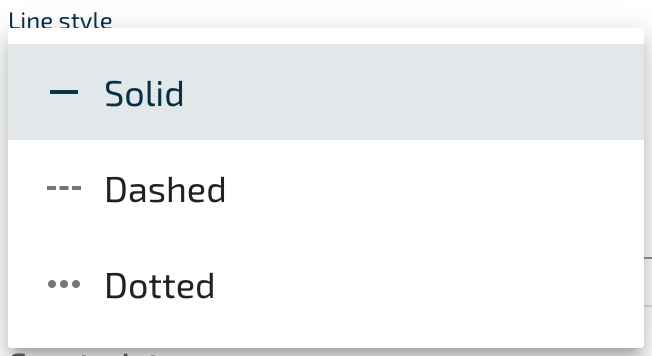
Start and end type of relations Line style Different styles for relation lines can be defined: Solid, Dashed and Dotted.
Creating Diagrams: Changing Relations' Appearance
Relation Line Styles

Structural Matching

The functionality of the “Enable structural matching” checkbox is described here: Structural Constraints.

Constraints & Analysis Rules (Coloring)

It is also possible to optionally define constraints and analysis rules for the selected asset/relation types.
  • Constraints: show only asset/relation instances that fulfill the constraints.
  • Analysis: asset/relation instances appear in the selected color if they fulfill the defined conditions.
Using the operators (AND/OR), multiple conditions for one constraint or analysis rule can be created.
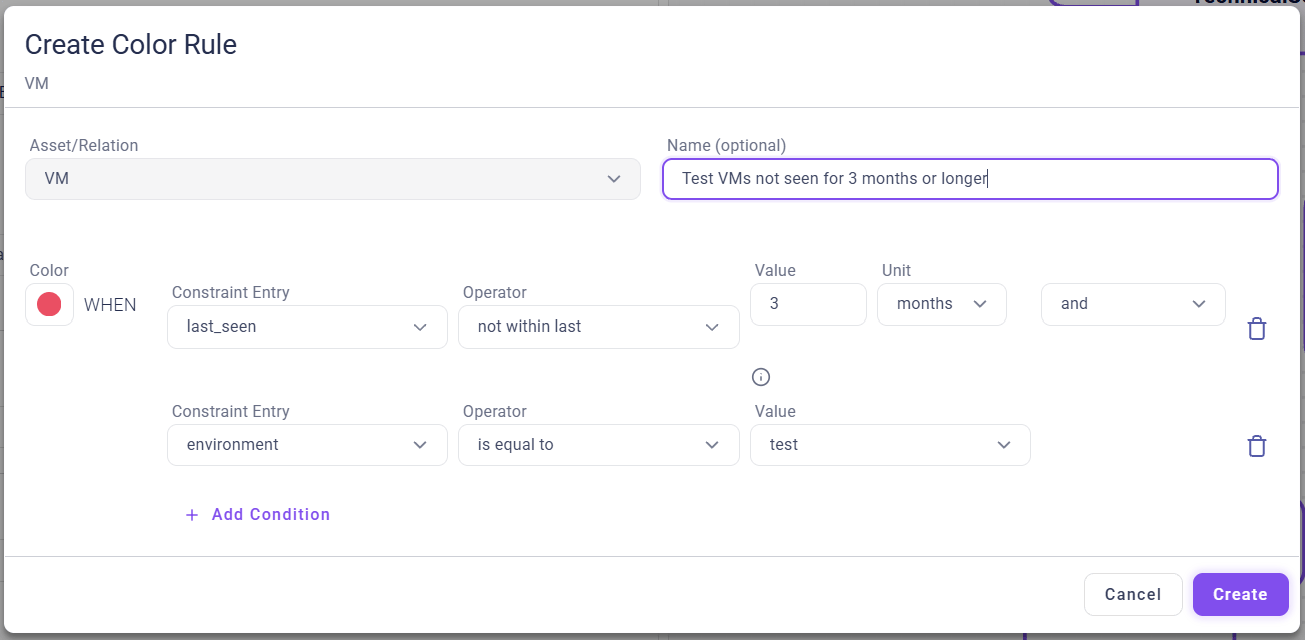
Creating Diagrams: Constraints & Analysis Rules (Coloring)
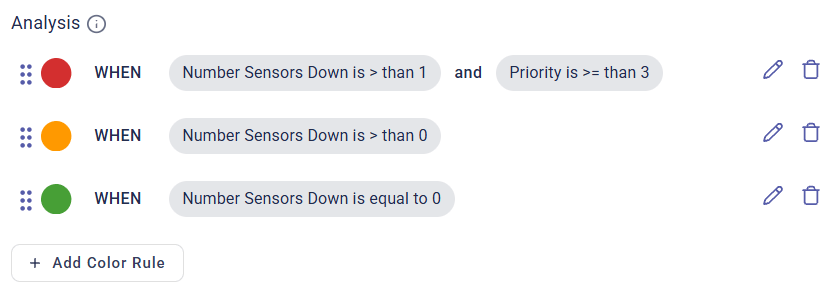
Example for defining an analysis rule with two conditions. Creating Diagrams: Constraints & Analysis Rules (Coloring)Example of three analysis rules with different numbers of conditions. If multiple “Analysis Rules” have been created, their priority follows the order from top to bottom, with rules placed higher up overriding those placed lower down. The position (and thus the priority) of the rule can be changed using drag and drop (click on the dot grid to the left of the rules).

Diagram View Summary

In the “Summary” step, the final data schema of the diagram view is shown. As a last step, a name and an optional description for the view can be defined.
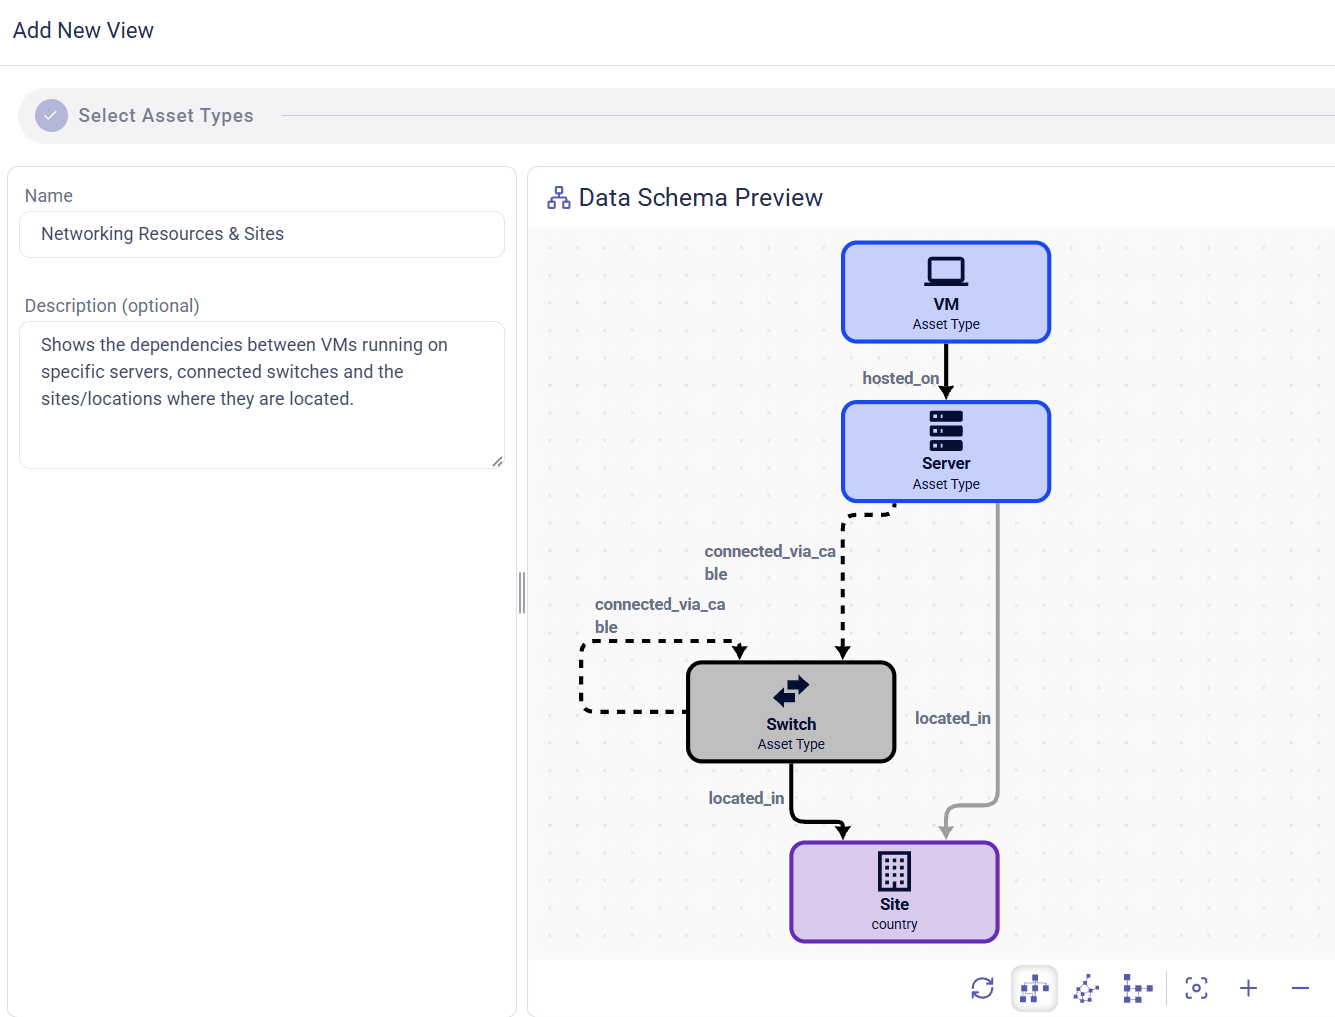
Creating Diagrams: Diagram View Summary
Diagram view summary