Overview
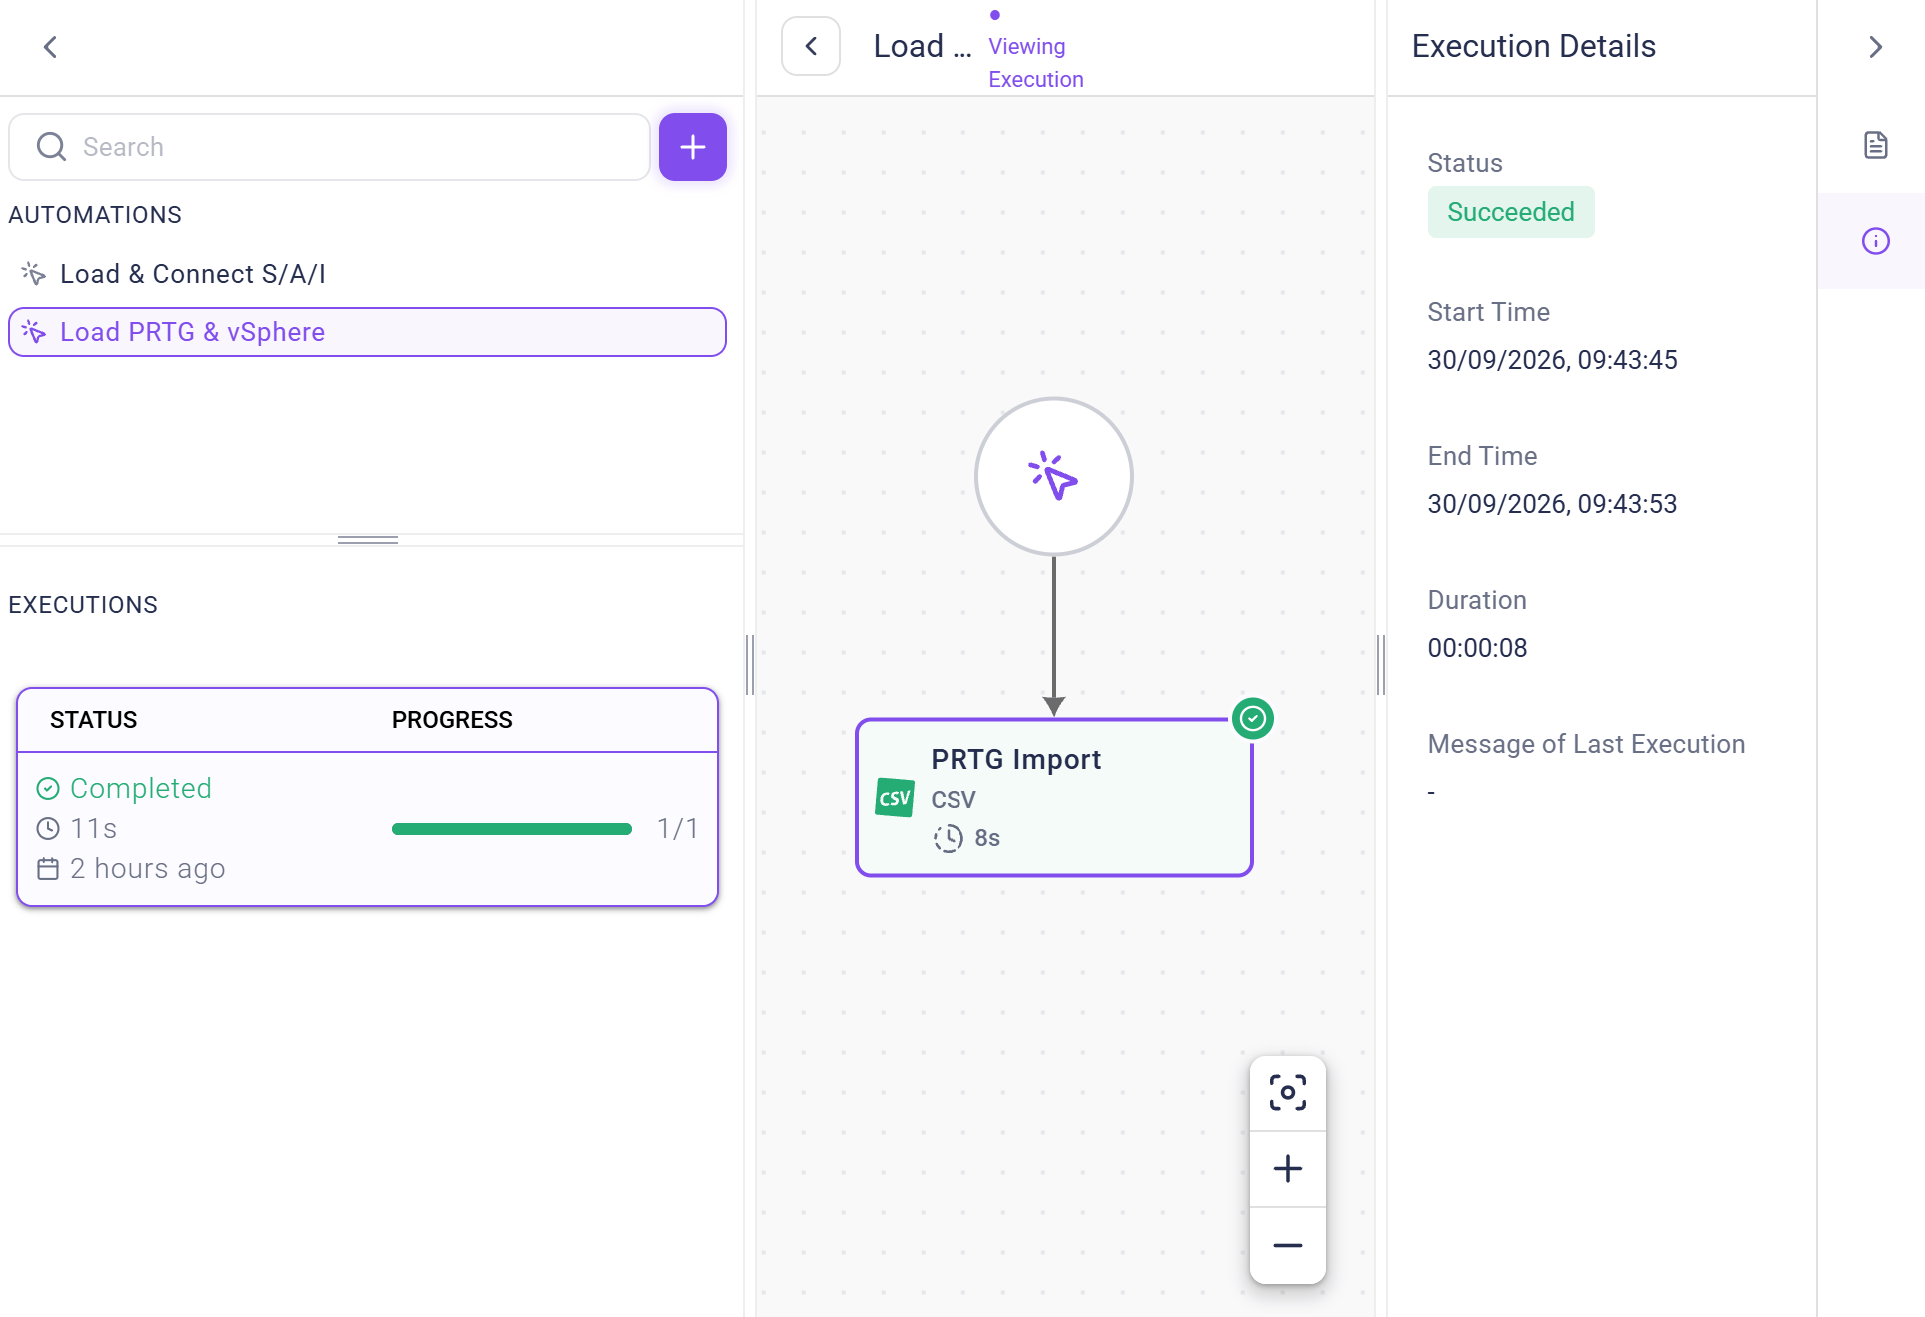
“Automations” enable managing the data import and consolidation within Qbilon. You can use them to connect external data sources, consolidate asset data with mergers and linkers, and write data to third-party systems. Within this context, Centralized Variables, Webhook Triggers, and Custom Tasks are powerful means to simplify and extend automations. Clicking onAutomations (fmr. workflows) in the main navigation sidebar opens the automations management section. This page uses a “master-detail layout” to improve navigation and visibility:
- The left sidebar (“Master”) displays a searchable list of all your automations and their current execution status.
- The central, main view displays the topology of the currently selected automation.
- The right sidebar shows details of the selected execution run or automation.
Automations Sidebar
The sidebar displays the search bar and a list of automations (sorted alphabetically). Clicking on a specific automation provides immediate insight into its status (last runs) and execution schedules. Now, the automation can directly be modified in the visual representation in the center by either clicking on the separate tasks or hovering over them to show the ”+” (add task) action button.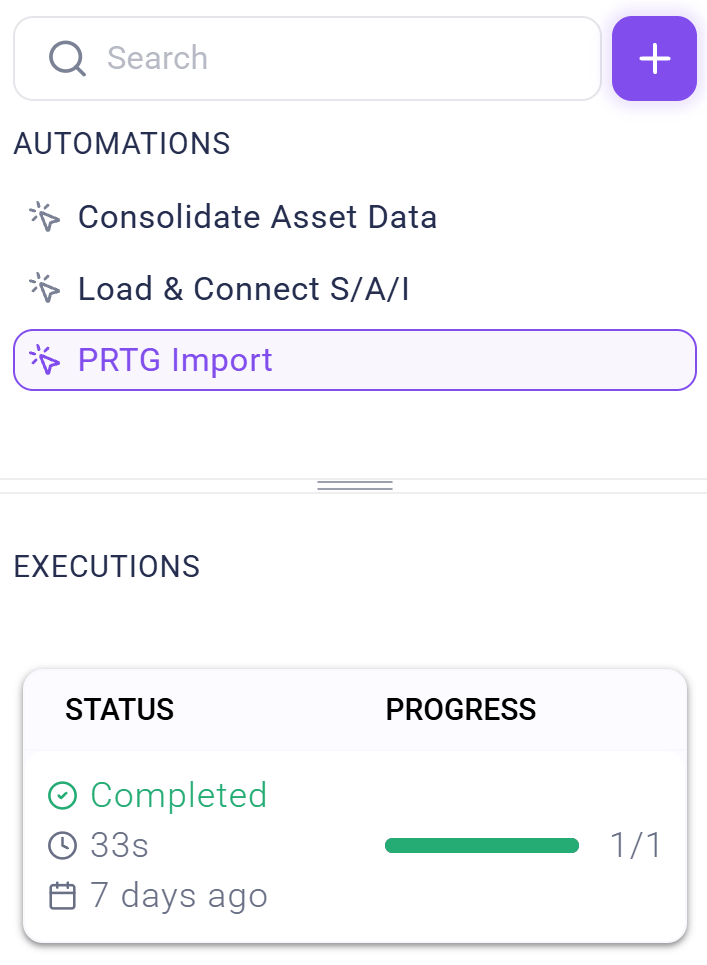
Automations List
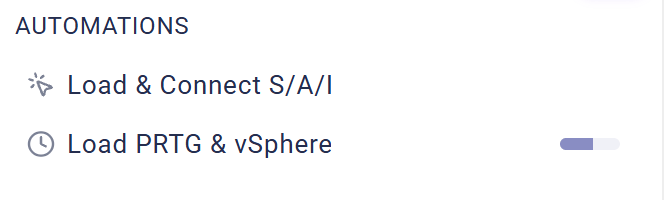
Each item in the automation list includes:- Trigger Icons – a preceding icon indicates the automation’s trigger type:
Onetime( ), i.e., running a data source import or a data consolidation task is only executed once (it can still be triggered manually anytime),
Scheduled( ), i.e., running a data source import or a data consolidation task is triggered periodically according to a specified interval and
Webhook( ), i.e., running a data source import or a data consolidation task depends on the triggering of a webhook endpoint in Qbilon (see Webhook Trigger for details).
- Running Status: If an automation is currently executing, an animated status spinner appears next to it.
- Selection: Clicking an automation highlights it and loads its details in the main view.
Status Indicators & Tooltips
Colored dots may appear next to an automation name to indicate specific states. Hovering over these dots also reveals a tooltip with more details. There are two different status indicators currently:- Failed Execution (🔴 red dot): indicates that the last run was not successful.
- Update Available (🔵 blue dot): indicates that a template used in the automation has a newer version available.
Executions Panel
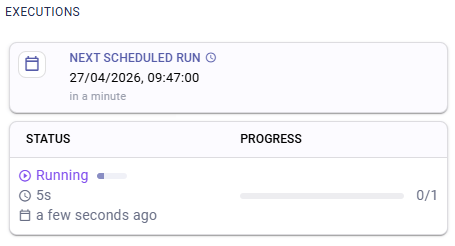
Located at the bottom of the sidebar, this section displays execution data for the currently selected automation. This information is read-only. There are at most two different execution cards available at once:Next Scheduled Run: If the automation has a schedule trigger, this card displays the date and time of the upcoming execution.Status&Progress, if currently an automation is running or has a past execution:Running: shows a progress bar (share of completed tasks)
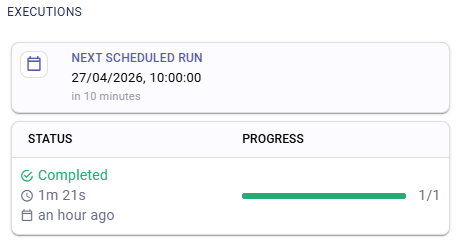
Completed: displays the final status (e.g., “success” or “failed”), the duration, and how long ago the execution finished. Hovering over the relative time (e.g., “15 mins ago”) shows the exact timestamp.
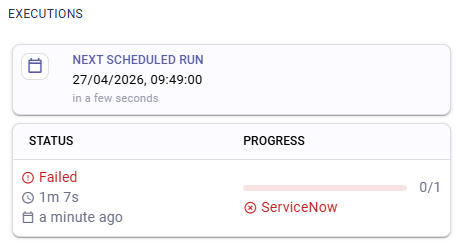
Failed: displays the name of the specific task that caused the failure is displayed.
No executions yet placeholder is shown.
Automation Topology View
Once an automation is selected, the main content area loads its topology.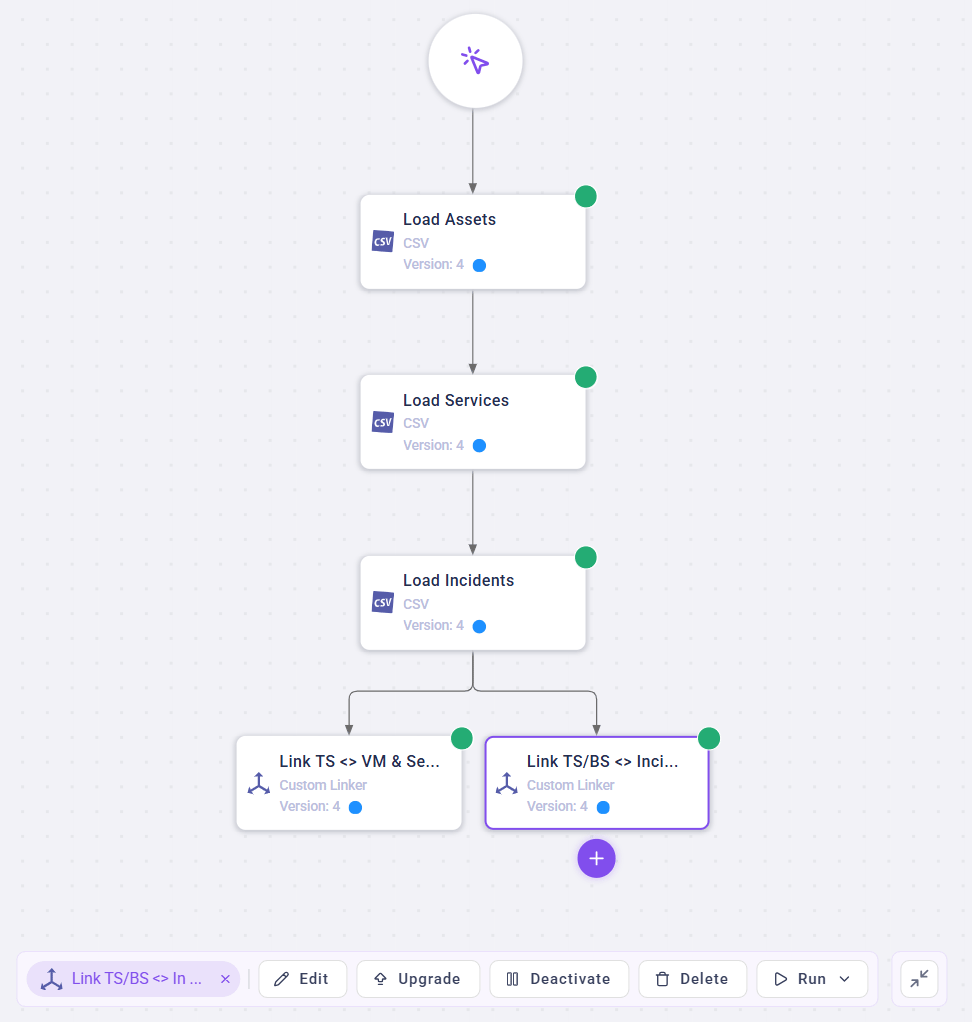
Header Actions
The header displays the automation name on the left and action buttons on the right.Run (Trigger): A multi-choice button to trigger the automation manually.Rename/Delete: Options to modify or remove the automation.
Topology
The topology provides a visual, interactive representation of the task sequence.- Visual Status: Tasks display their current status (
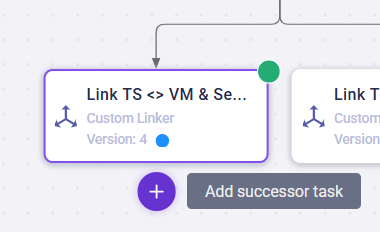
Ready,Running,Error). If a task has a newer template available, a blue dot (🔵) appears on the task node. - Task Toolbar: When a task is selected in the topology, a toolbar appears at the bottom:
Run→ Trigger the execution of that specific task.Upgrade/Downgrade→ If a newer or older template version is available, use the “Upgrade” or “Downgrade” button to switch to that version.Edit/Deactivate/Delete→ Manage the selected task directly.
Add successor task→ The “plus button” appears when hovering over a specific task. Clicking on it opens a dialog for defining a new task at this position.-
- Task Details Panel: Clicking a task node in the topology opens a details panel on the right side with three tabs:
Data Source Details,Warnings & Errors, andExecution Details.Data Source Details→ provides details about the task such as the specific configuration of a merger.Warnings & Errors→ shows log messages from prior executions such as the number of processed nodes.Execution Details→ displays the time of the next and last execution (together with its duration).
Managing Automations
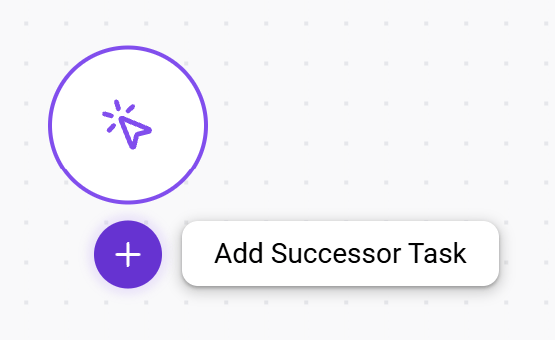
To create a new automation (workflow), click on the “plus button” in the left sidebar. After typing in a name and selecting the trigger type, a new automation is finished by clicking on the “Create” button within the overlay dialog. Now, new tasks can be added by hovering over the “cursor icon circle” in the central topology view and clicking on+ Add Successor Task.
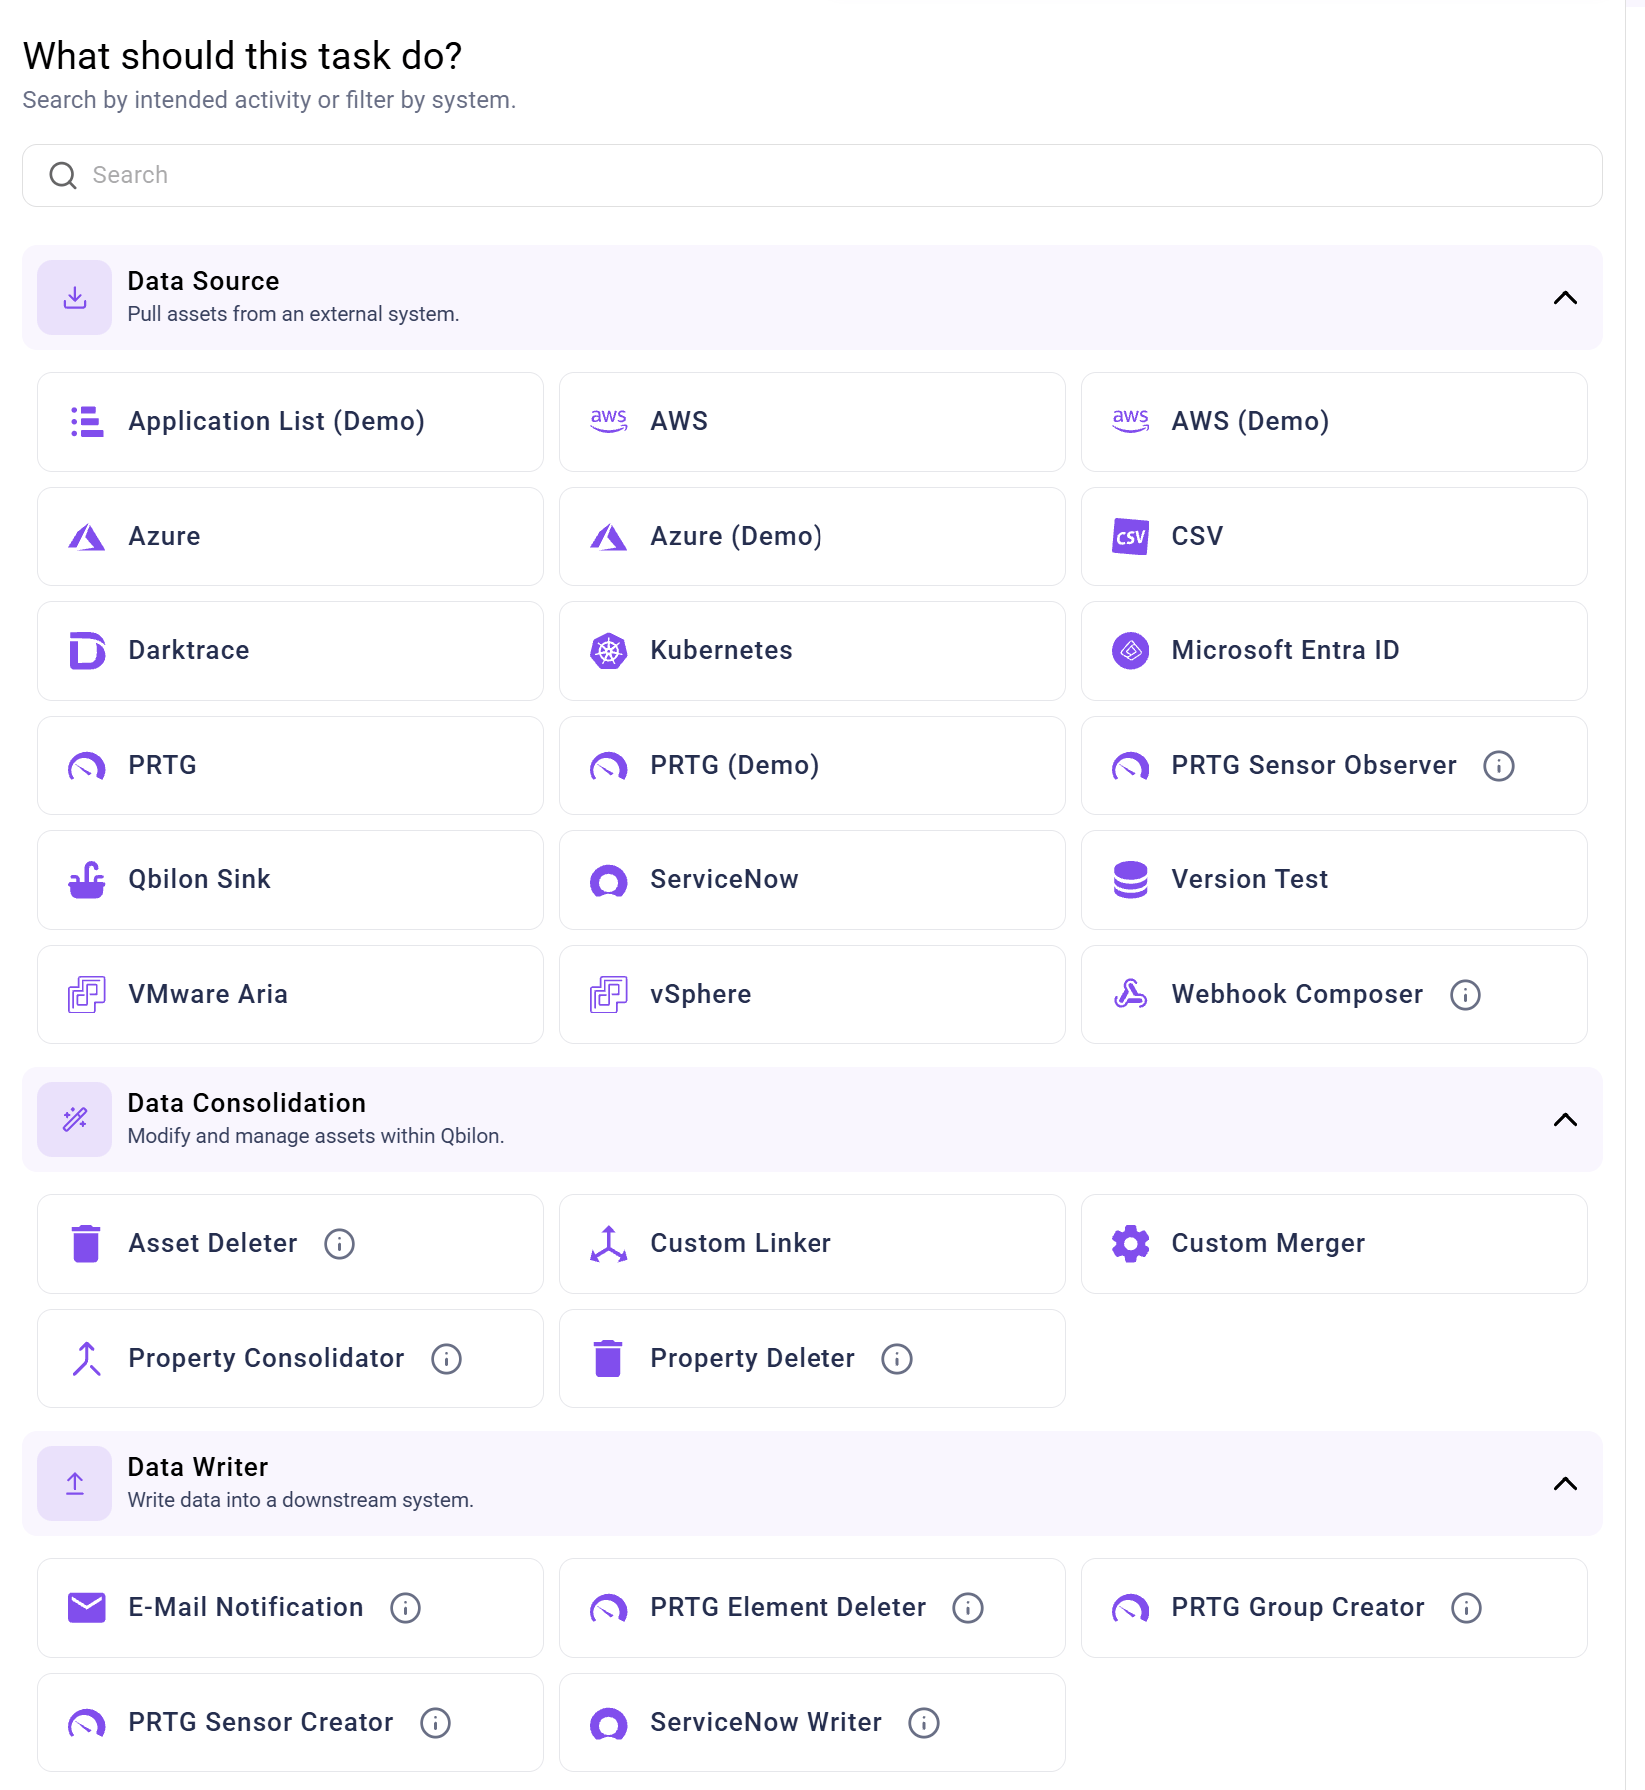
Create Task panel on the right side where the user can browse and select tasks from three different categories:
Data Sources: add a new data source (as shown below). See Data Sources for details.Data Consolidation: create consolidation tasks such as Mergers and Linkers.Data Writer: create writer tasks such as PRTG Sensor Creator or ServiceNow Writer. Details on consolidation and writer tasks are available in the chapter “Data Consolidation & Writer”.