
What is Qbilon?
Qbilon is an IT asset data hub and automation platform. It serves as an all-in-one platform for IT asset data management, enabling large companies to implement automatic documentation and the subsequent complete automation of their IT landscape in a single tool. The key features are:- Centralization ➝ Combine IT assets and data from multiple sources into a single accurate, duplicate-free database.
- Integration of Multiple Data Sources ➝ Seamlessly import data from unlimited sources and distribute across connected systems within the IT landscape.
- Automation ➝ Get rid of manual data entry with automatic data synchronization and consolidation to streamline IT asset management.
- Customizable Orchestration ➝ Provide configurable task orchestration and simplified automation/workflow creation to integrate data and tools across the IT landscape.
- Visibility ➝ Generate comprehensive real-time IT maps, inventories and report tables.
- Real-Time Network Monitoring → Benefit from PRTG’s monitoring capabilities integrated in our Qbilon Suite product (see setup steps here).
- Importing & Consolidating Data from Multiple Sources
- Building Automations in Qbilon’s Workflow Engine
- Use Case “Risk Assessment”
- Use Case “Service Mapping & Root Cause Analysis”
Changelog
For an overview of recent changes to Qbilon, see our changelog.Glossary
Asset
Assets are existing instances of asset types, e.g. a specific server instance.Asset Property
Asset properties can be seen as “attributes” that assets (or relations) have, e.g., an ID, a name or the date when they were first/last seen. Based on these properties, further reasoning can be made.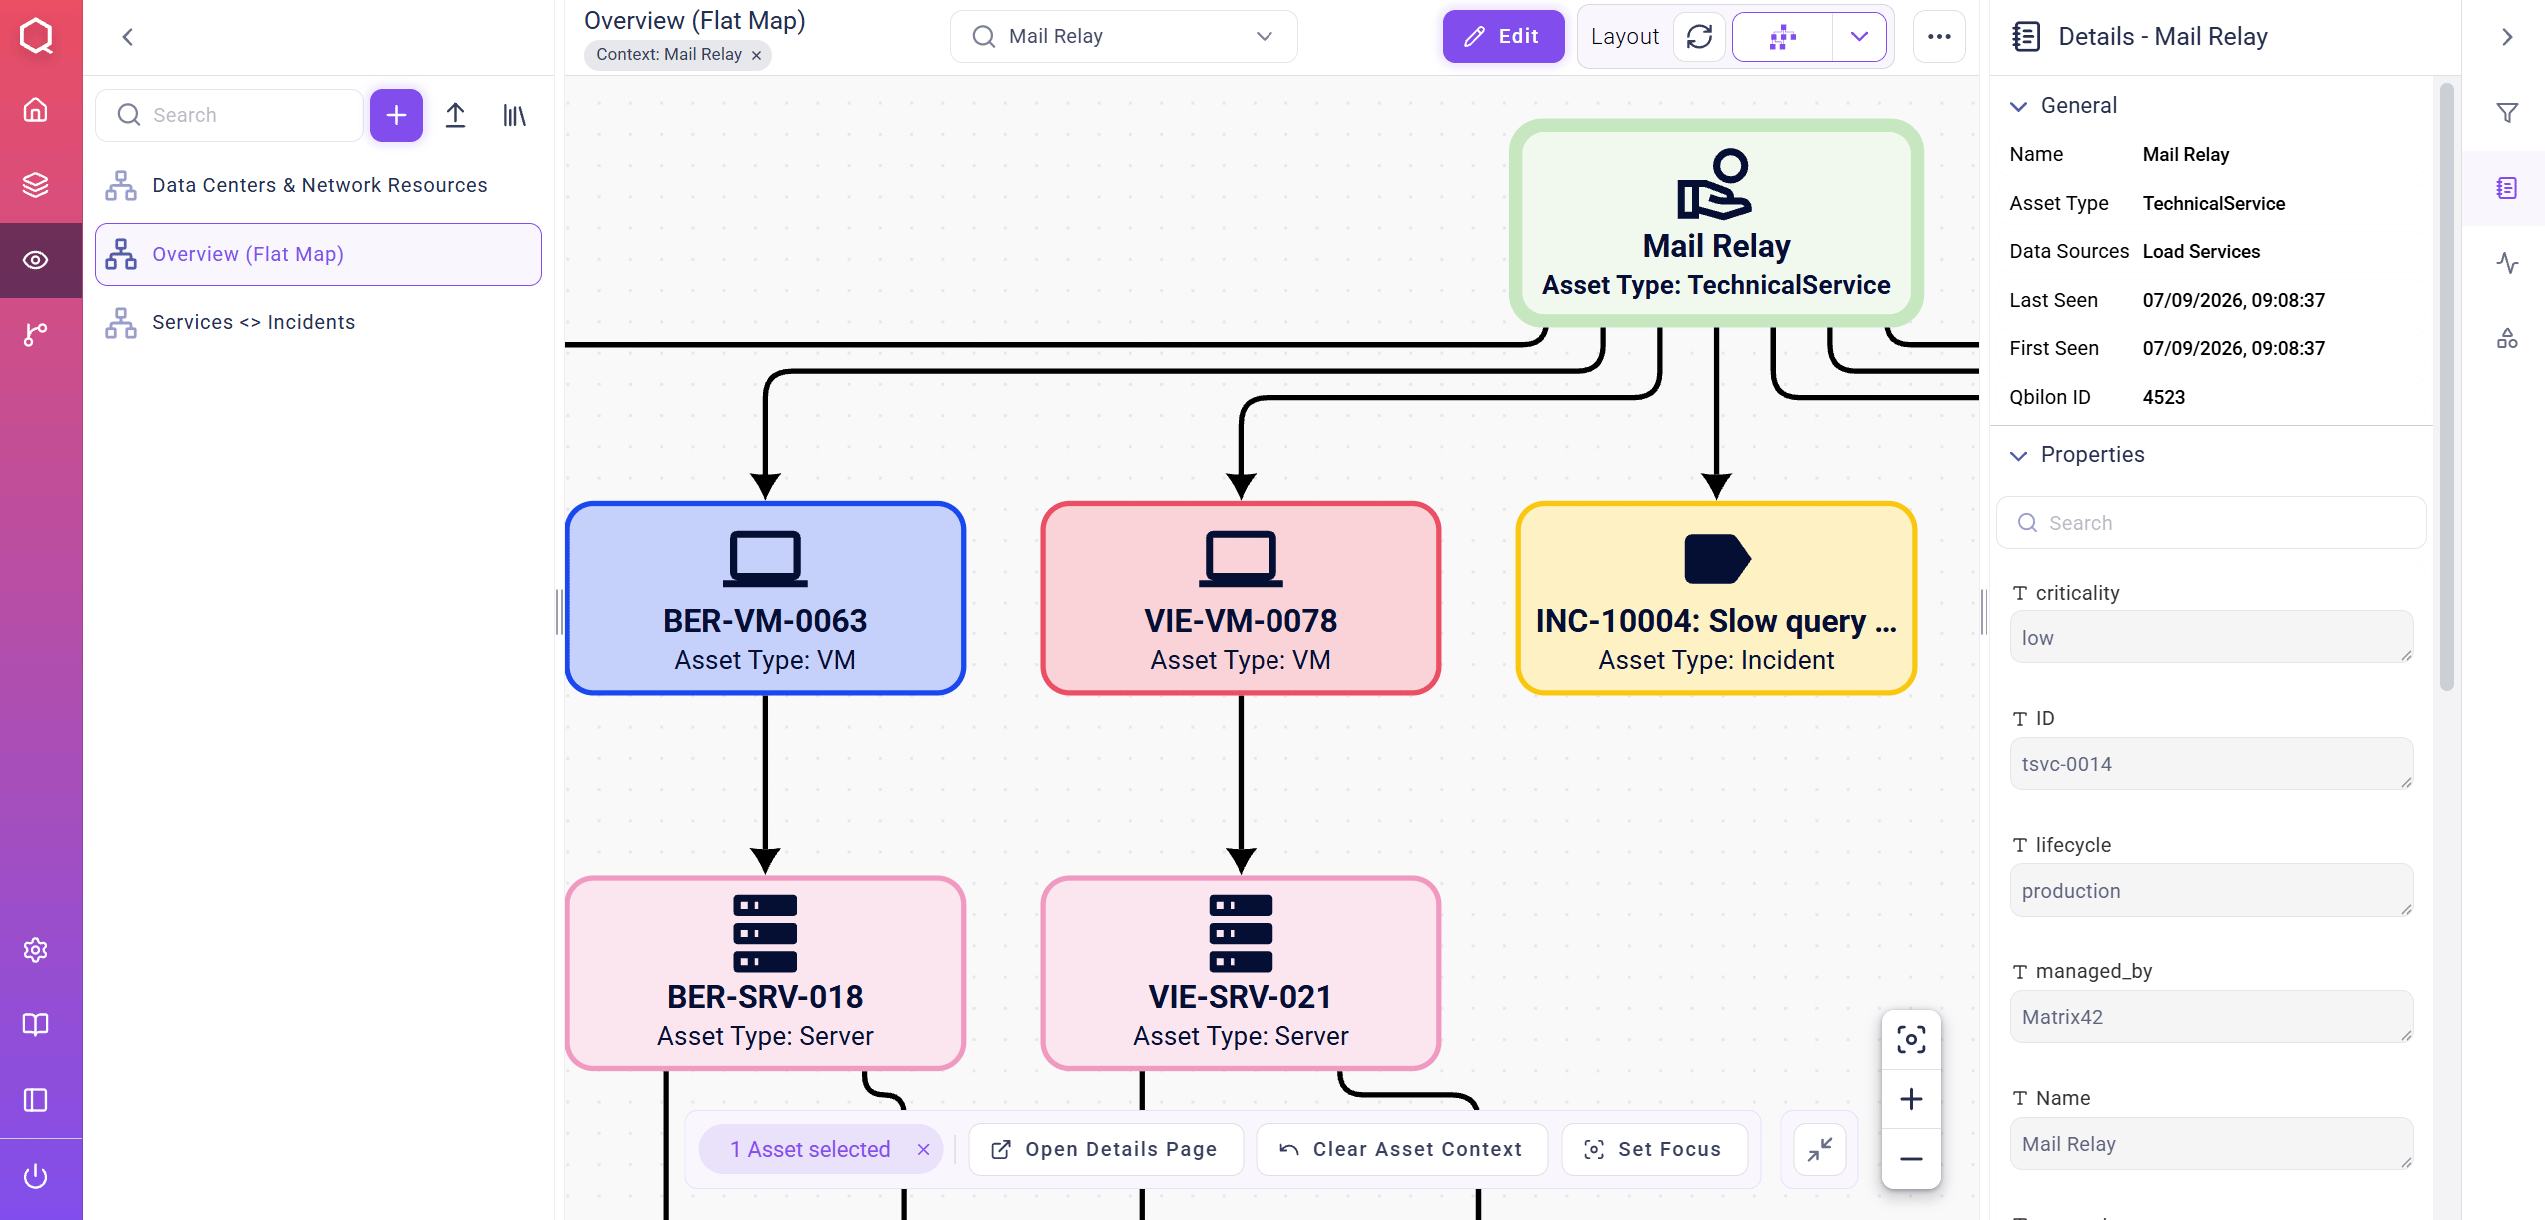
Mail Relay are shown in the right sidebar.
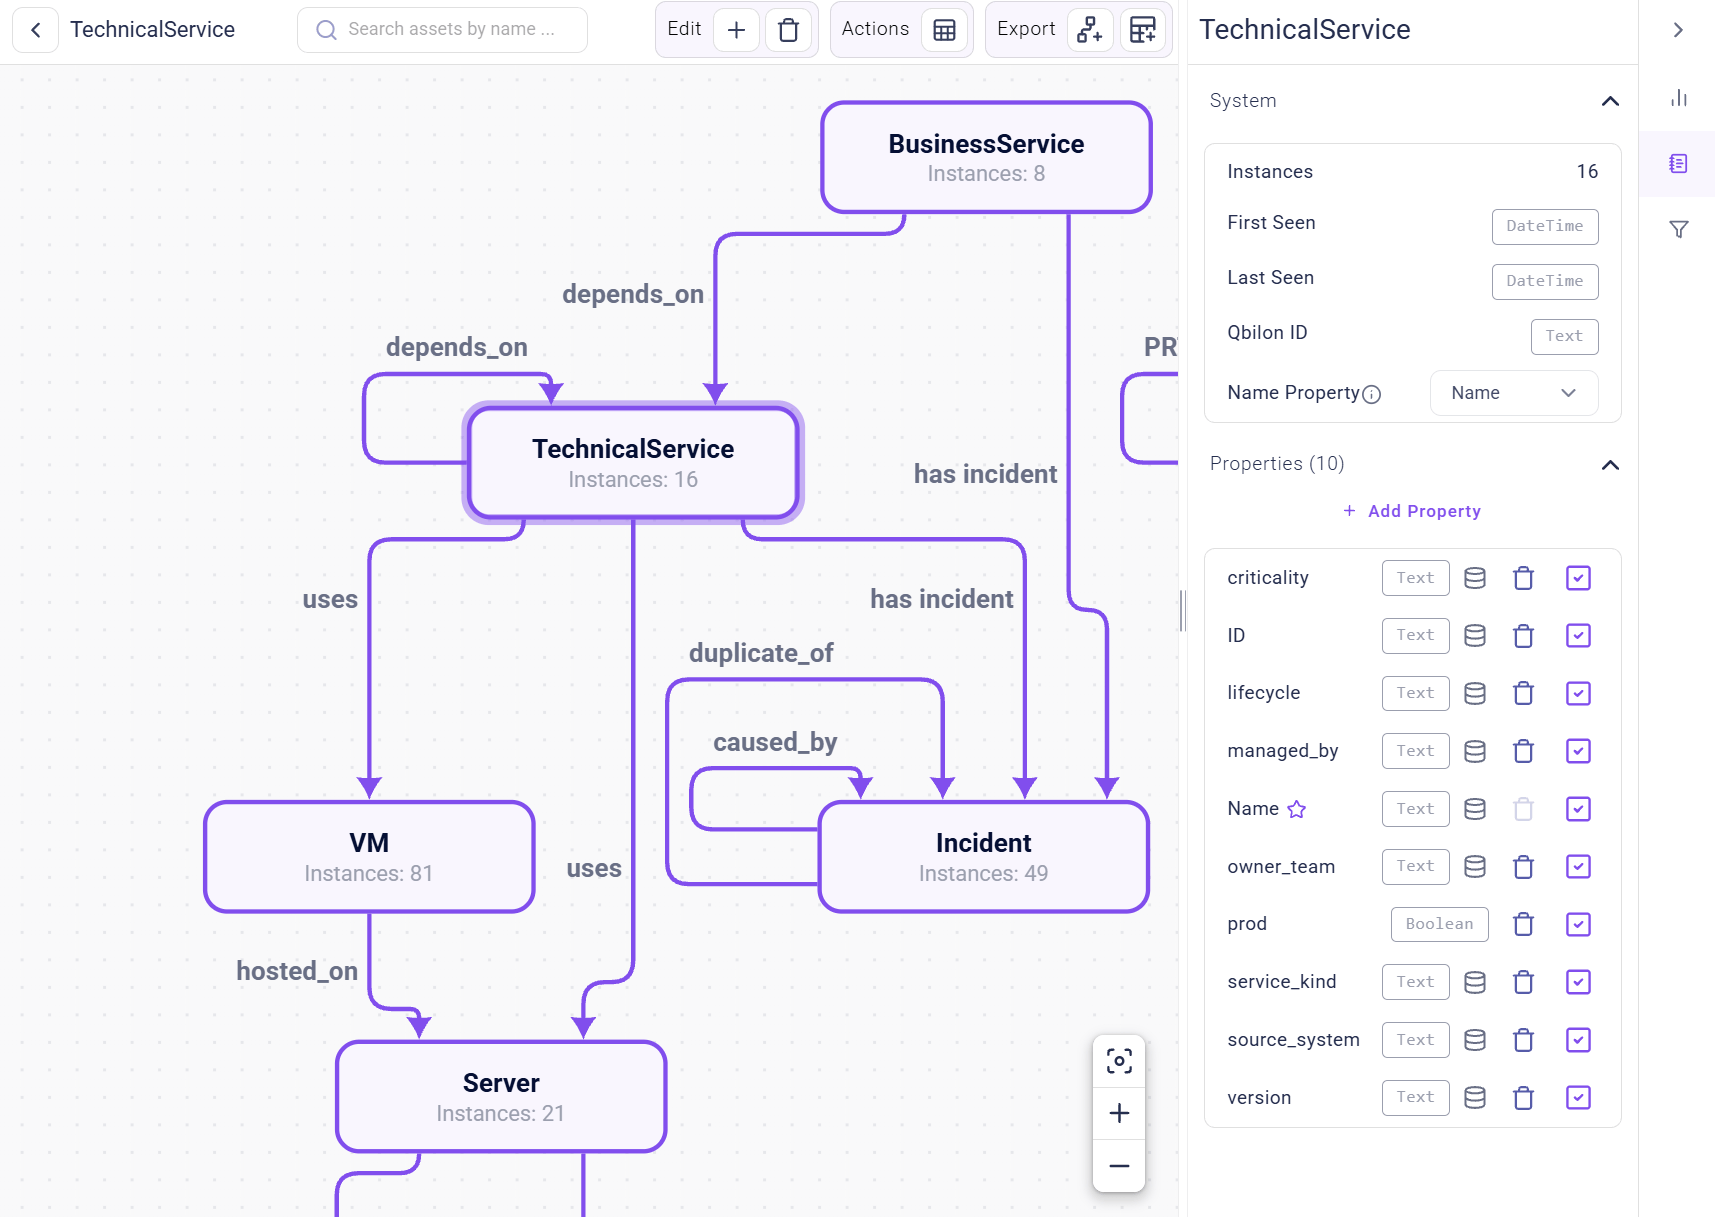
Asset Type
In the data schema, asset types are not actual instances of IT assets but do represent existing “asset classes”, e.g.,Application and Service.
Custom View
Based on the data schema, views can be created by choosing specific asset types and relation types. These types will later be replaced by real instances in the corresponding diagram or table view. According to the selected types, created views show the IT data from different perspectives and on different abstraction layers, enabling them to serve countless use cases. In addition, analyses can be performed by applying constraints, filters and analysis rules (coloring) on the data.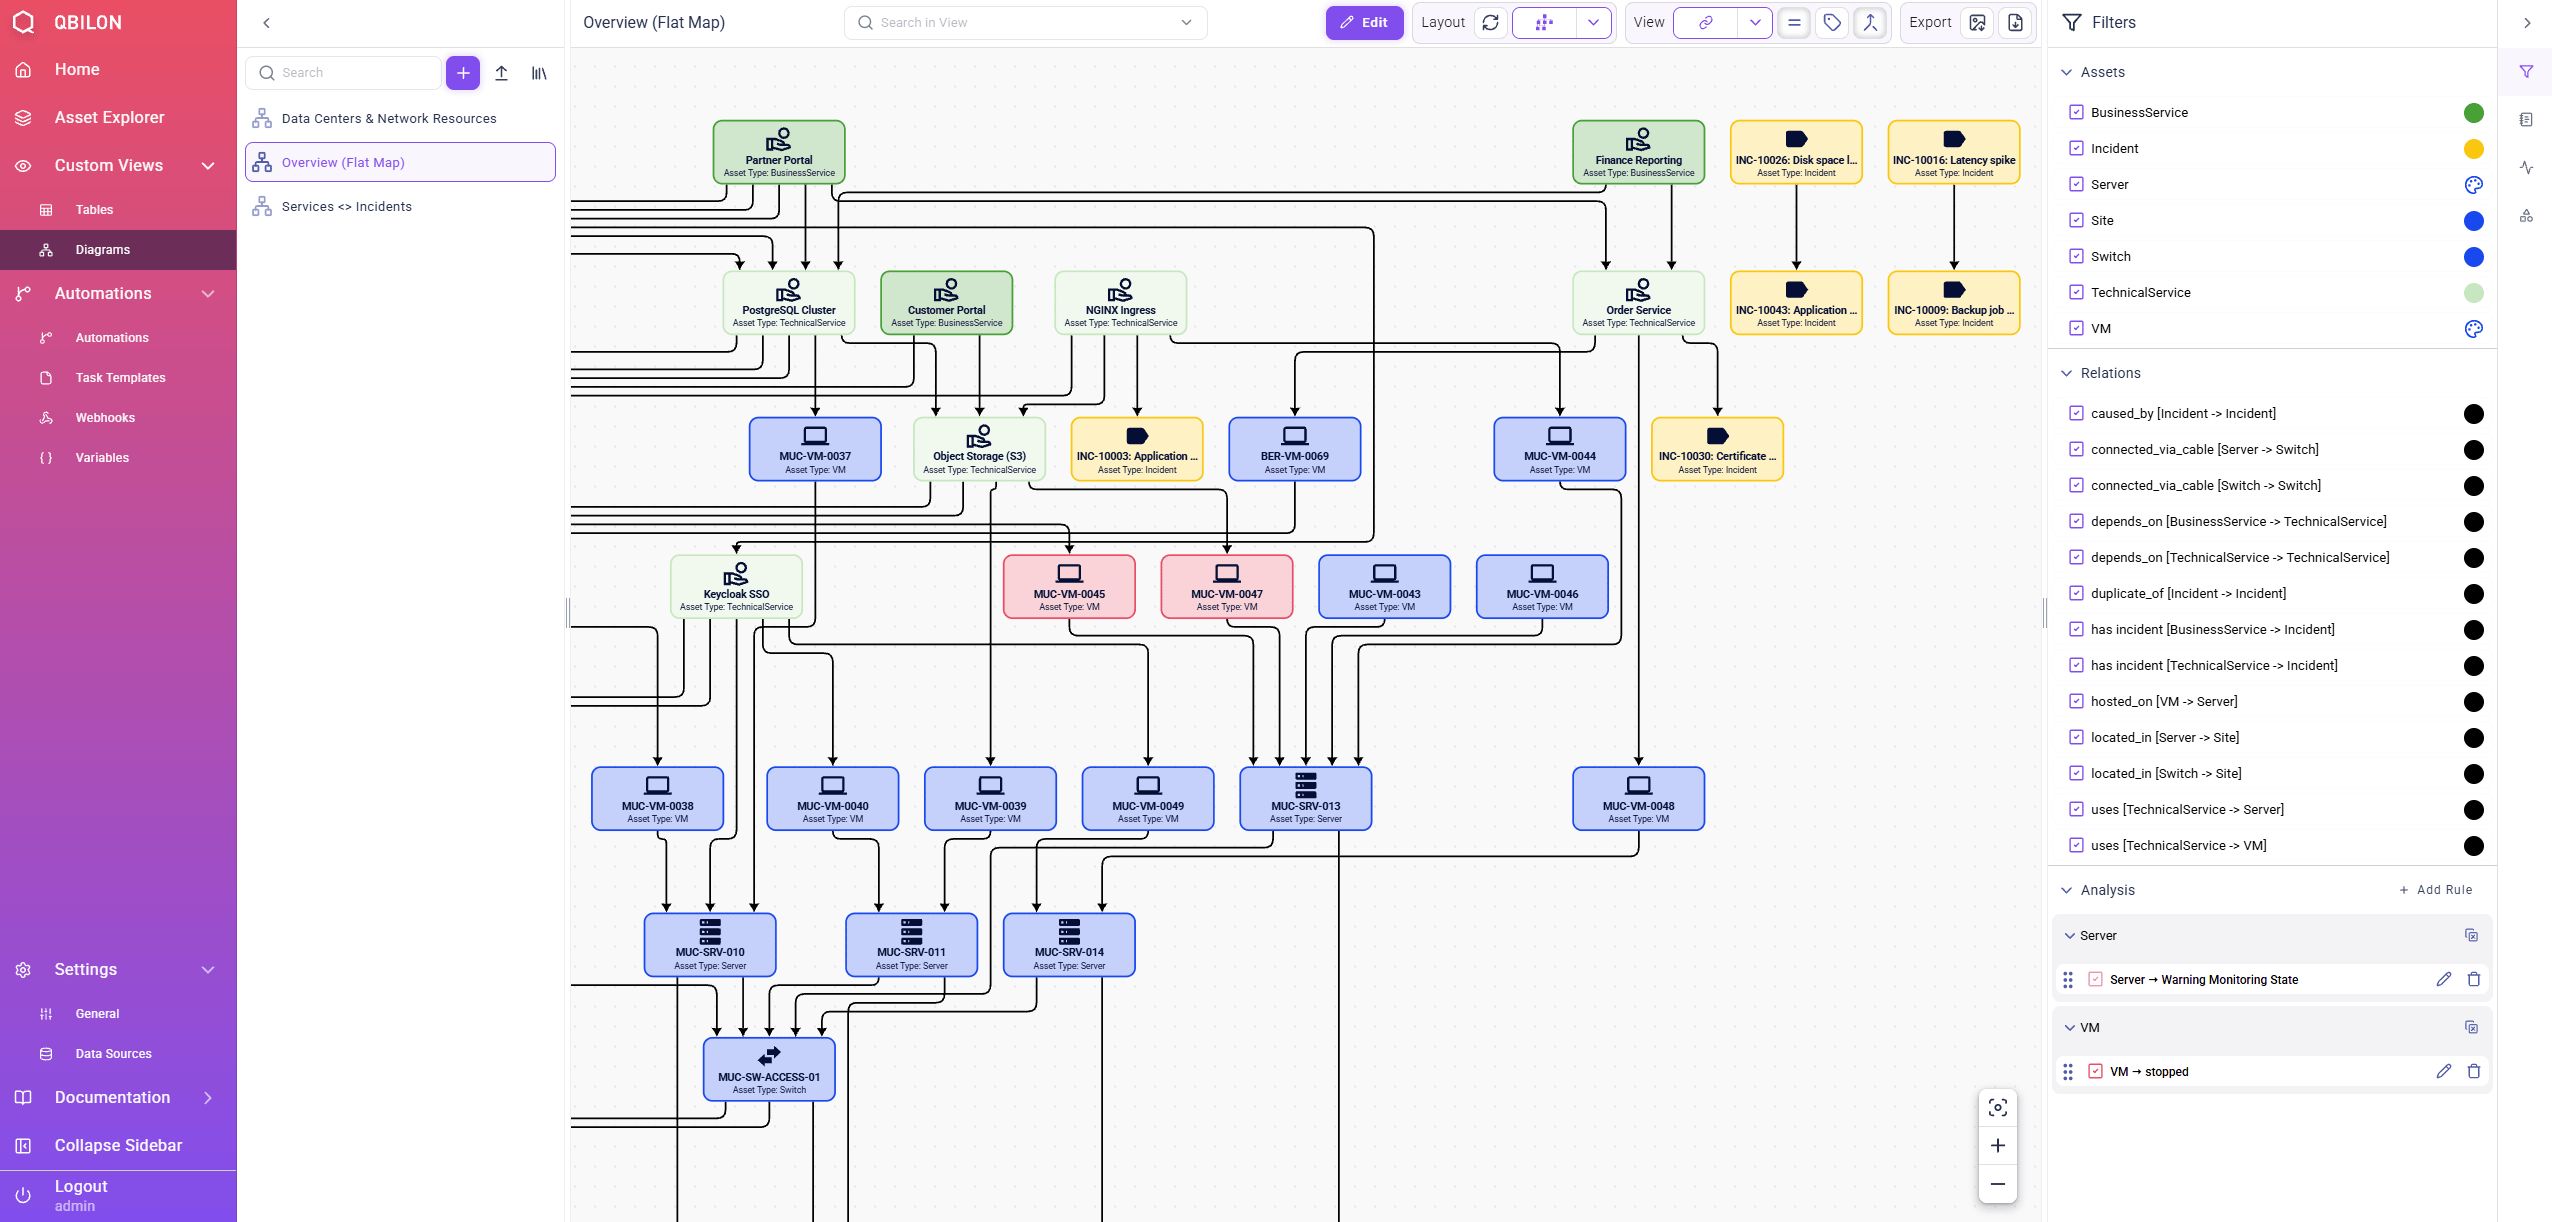
Data Schema
A Data Schema is automatically generated when importing a data source. It consists of asset types and relation types and shows the general structure of the data. Custom views (tables and diagrams) are created based on the data schema.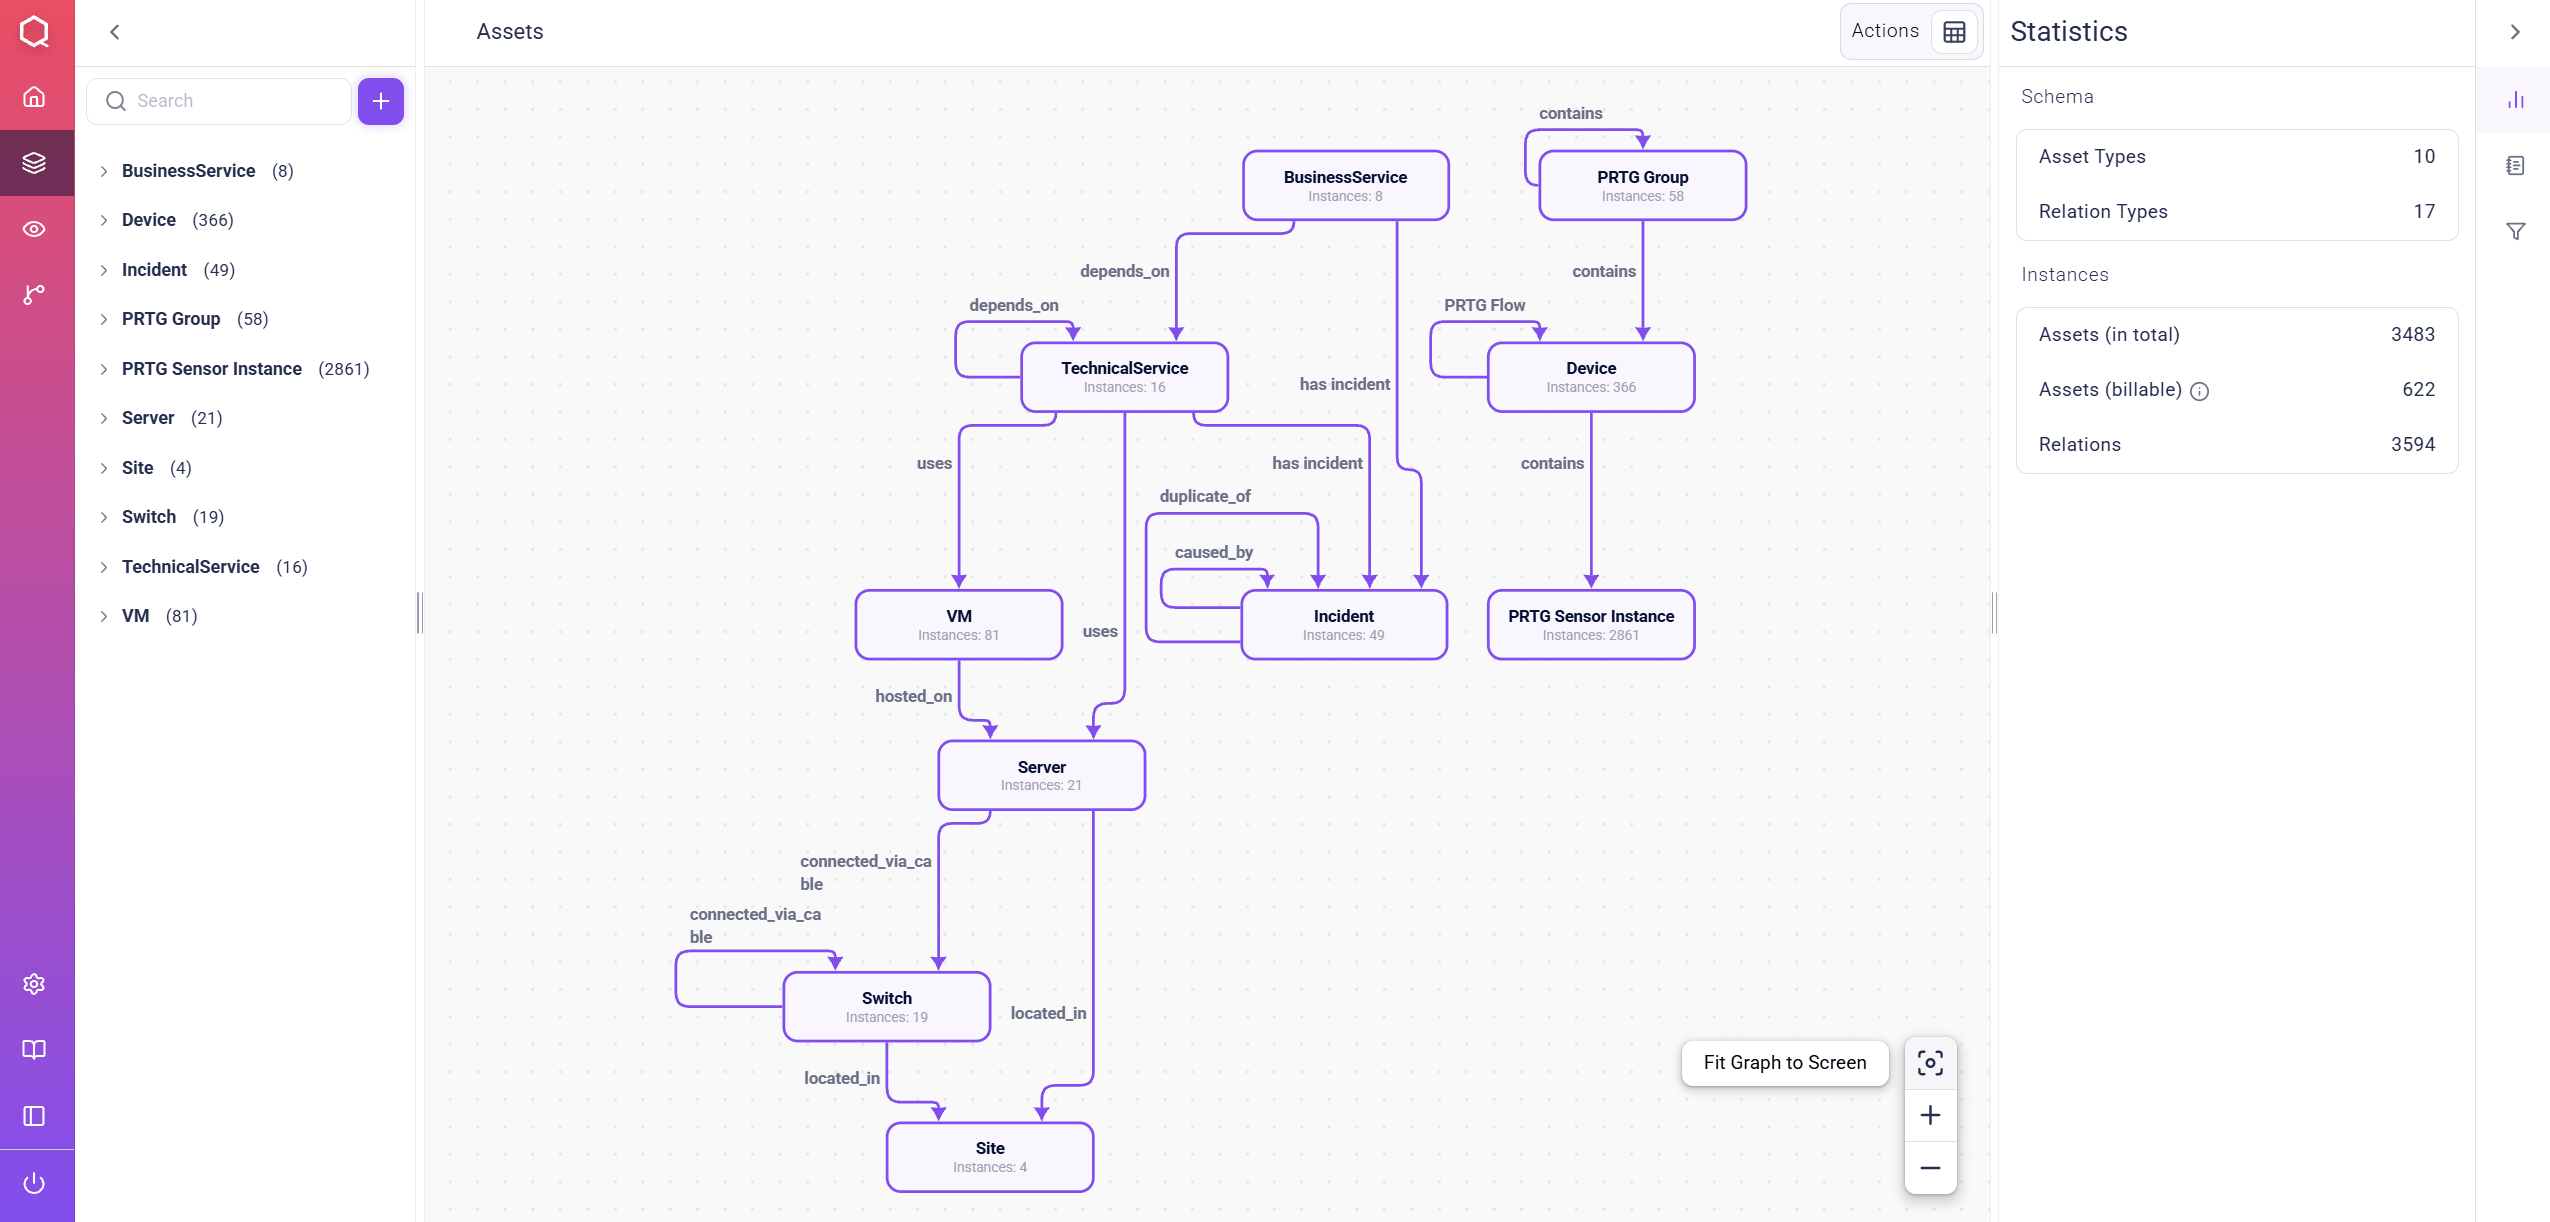
Data Source
Data sources are required to load the data into the Qbilon software via “connectors”. Based on this data, a data schema is generated. This data schema is used to create different views (diagrams and tables) that enable the user to perform analyses.Grouped Asset
Relations can also be visualized as containers (nested hierarchies). Here, the source asset of a relation type represents the container that incorporates all of it target assets instances, e.g., several virtual machines running on one common physical server.Linker
Linkers are used to create new relations between two asset instances, e.g., using communication data from a monitoring data source to capture the dependency between certain computing resources.Merger
Mergers are employed to combine different data sources that involve information on overlapping (identical) assets or relations. For example, if both data sources contain information on server instances, the data for each server instance is collected and shown as single IT asset with a united, sound set of properties. Occurring data inconsistencies (contradictory information) are resolved following a configurable consistency strategy.Relation
Relations are existing instances of relation types that, e.g., show communication or logical dependencies between two assets.Relation Property
Relation properties can be seen as properties that relations (or assets) have, e.g., an ID, a name or the date when they were first/last seen. Based on these properties, further reasoning can be made. Properties are shown in the right sidebar after clicking on a relation within a diagram view.Relation Type
In the data schema, relation types show the existing relations between different asset types.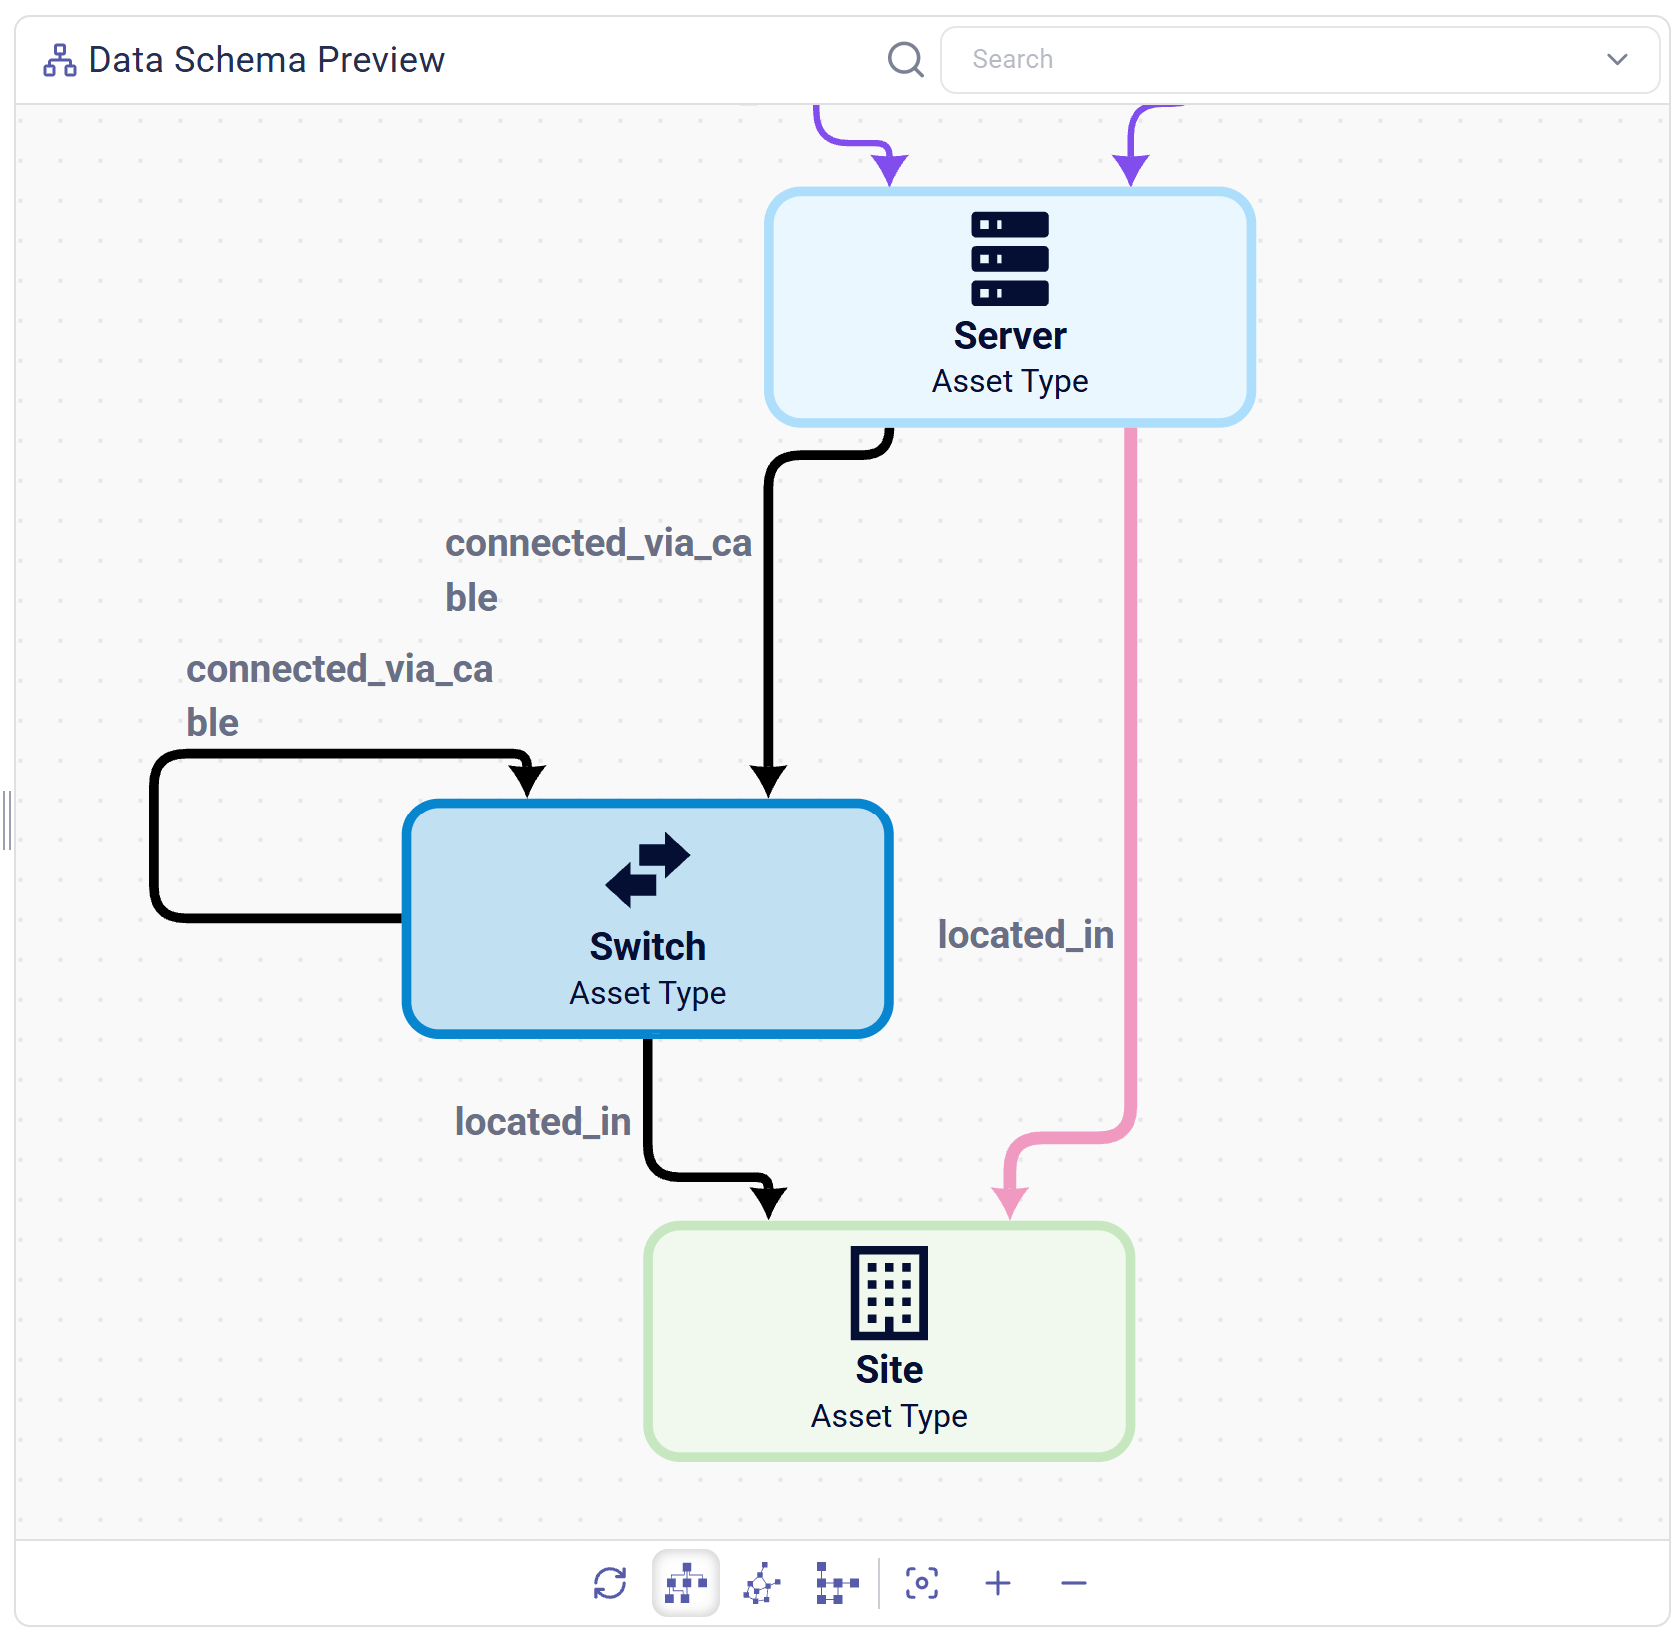
located in connects the asset types Server (as “source” asset) and Site (as “target” asset).